Most DTC LTV figures are revenue-based and roughly double the real number. LTV that drives spending must be measured on gross margin, not revenue, or you will overpay for customers.
- Dashboard LTV (AOV x frequency x lifespan) counts dollars you never keep.
- Use gross-margin LTV to hold a true 3:1 LTV:CAC guardrail.
- A revenue-LTV 3:1 is closer to an unhealthy 1.5:1 once margin is stripped out.
There is a brand doing $8M in revenue that believes their LTV is $240. That number comes from their Shopify Analytics dashboard, average order value, multiplied by purchase frequency, multiplied across the customer lifespan as the platform reports it. The calculation is clean. The spreadsheet looks right. And it has been driving their acquisition strategy for 18 months. Acquisition is also where a partnership changes the math, since the customers a collaboration brings in arrive at a different cost than paid, part of the case for brand partnerships. For where LTV and retention sit against the rest of the numbers, see the 2026 DTC and Shopify app benchmarks.
The actual number, when you run it properly (contribution margin adjusted, cohort-segmented, time-discounted) is closer to $140. That $100 gap means every channel decision they've made has been off. They've been paying more to acquire customers than those customers are actually worth at the margin. They know revenue is growing. They don't know the margin is compressing. They think growth is working.
This is the most common and most costly math error in DTC. Not fraud, not negligence, just the wrong methodology, applied with confidence, at scale. The brands that close the $5M inflection point are almost always the ones that figured this out first.
The money words,
explained like
you're new to it.
Before the framework, the plain-English version. LTV, lifetime value, is the total profit a single customer brings you over the whole time they buy from you, not the revenue from their first order. CAC, customer acquisition cost, is what you paid in ads and effort to get that customer in the door. The entire game is simple to say and hard to do: earn more from a customer over their life than it cost to acquire them, and earn it back fast enough that you are not bleeding cash while you wait.
The trouble is that half these terms get used loosely, and a brand that confuses revenue with margin, or blended with paid, will talk itself into a number that is not real. Here is the vocabulary in language a normal person actually uses.
| Term | What it actually means |
|---|---|
LTV (Lifetime Value) | The total contribution profit a customer gives you across every order they ever place, not their first-order revenue. Spend $80 a year at 60% margin for three years and your LTV is roughly $144, not $240. |
CAC (Customer Acquisition Cost) | Everything you spent to win one new customer (ad spend, agency fees, the discount on their first order) divided by the customers it brought in. |
Blended vs paid CAC | Blended CAC divides total marketing spend by all new customers, including the ones who found you free. Paid CAC counts only customers from paid ads. Paid is the honest number for deciding whether to spend more. |
Contribution margin (CM) | What is left from an order after the costs that scale with it: product, shipping, payment fees, fulfillment. The real money an order puts in your pocket, before fixed overhead. |
COGS (Cost of Goods Sold) | What the product itself costs you to make or buy, landed in your warehouse. The first thing subtracted from a sale. |
AOV (Average Order Value) | The average dollar amount per order. Raising it is often the fastest way to fix broken unit economics. |
Gross vs contribution margin | Gross margin subtracts only COGS. Contribution margin subtracts COGS plus shipping, fees, and fulfillment. Contribution margin is the one that tells you if a sale is actually profitable. |
Payback period | How many months of a customer's spending it takes to earn back what you paid to acquire them. Under a quarter is healthy for most DTC brands. |
Cohort | A group of customers who first bought in the same month, tracked over time. Cohorts show whether repeat behavior is improving or decaying, which averages hide. |
Repeat rate / frequency | The share of customers who buy again, and how often. The single biggest lever on LTV, and the one most brands ignore. |
That is the vocabulary. The rest of this piece is about the math brands get wrong with it, and the framework that fixes it.
Wrong LTV is not
a data problem.
It's a strategy problem.
LTV is not a vanity metric. It is the number your entire acquisition strategy sits on. Your CAC ceiling (the maximum you can justify paying to acquire a customer) is a direct function of LTV. Your channel mix decisions depend on which channels produce customers with the highest actual lifetime value, not the highest volume. Your retention investment is justified or cut based on what a retained customer is worth. If you want that ceiling as an actual number, you can work out your max allowable CAC with the free calculator I built for exactly this.
When LTV is wrong, everything downstream is wrong. You overpay on Meta. You underinvest in channels that produce genuinely high-value customers. You deprioritize retention work because the LTV number looks acceptable without it. The cascade of bad decisions compounds quietly for months (sometimes for years) before the margin reality becomes undeniable.
Most Shopify brands calculate LTV the way the platform presents it: average order value times average purchase frequency times some version of customer lifespan. That formula uses averages across the entire customer base, and it uses gross revenue instead of what you actually keep after COGS, returns, discounts, and fulfillment. The result is a number that feels real because it came from your data, but it is systematically inflated and strategically misleading.
A customer who bought three times but only on 40% discount days is not the same as a customer who bought three times at full price. Blended LTV treats them identically. That is the problem. How much margin a discount can responsibly borrow from future orders is exactly what the conversion vs margin tipping point computes.
The brands that get this right do not have better data than the ones that get it wrong. They have a different methodology. The methodology is not complicated. What it requires is discipline, the discipline to measure what you actually keep, not what shows up in your revenue line, and to track it at the cohort level rather than the aggregate.
Three errors.
Each one makes
the next one worse.
These are not independent mistakes. They stack. A brand that averages instead of cohorts, calculates on gross revenue instead of contribution margin, and ignores time decay has an LTV figure that is wrong in three directions simultaneously. Fix one and your number improves. Fix all three and the picture looks completely different. The downstream number all of this feeds is DTC profitability, benchmarked line by line.
Error 1: Averaging Instead of Cohorting
Aggregate LTV hides the trend that matters most. When you calculate LTV across your entire customer base, you blend customers acquired three years ago with customers acquired last month. The old cohorts (acquired when your product was newer, your retention program was tighter, your organic word-of-mouth was stronger) drag the average up. The new cohorts, which reflect your current acquisition reality, are masked underneath.
A brand with genuinely deteriorating retention can show flat or even improving aggregate LTV for 12 to 18 months because the historical cohorts are carrying the number. By the time aggregate LTV starts declining, the new cohorts have been underperforming for over a year. You've been making acquisition bets based on the retention profile of customers you acquired years ago.
The right unit of analysis is the cohort: customers acquired in the same calendar month, from the same channel, buying the same first product. That's where the real signal lives.
Error 2: Gross Revenue Instead of Contribution Margin
Revenue LTV is theater. What matters is what flows through to the business after you've subtracted everything that leaves when a customer buys. That means COGS, fulfillment per order, returns and the associated reverse logistics cost (average reverse fulfillment in ecommerce runs $8 to $18 per return), and the channel-specific discounts you issued to acquire or retain that customer.
Contribution LTV = gross revenue minus COGS, minus fulfillment, minus returns cost, minus discount spend on that customer's orders. That is the number that tells you whether you're building a business or just building revenue.
A brand running frequent 30% discount days may show strong revenue LTV because purchase frequency is elevated by the promotions. Contribution LTV will look very different. The same customer who shows up as $280 in revenue LTV might be $95 in contribution LTV after their discount history and return rate are applied. Every acquisition decision made on the $280 number was wrong.
Error 3: Ignoring Time Decay
A dollar of margin received three years from now is worth less than a dollar today. Cash you can deploy into inventory and acquisition this year is worth more than cash you'll receive from a re-order in year three. Most DTC brands calculate LTV over an extended horizon (sometimes the full "lifetime" of the customer) without applying any time discount to future cash flows.
For most DTC brands, the practical solution is to use 12-month and 24-month CM-LTV windows as primary metrics. Not "lifetime." These windows are close enough to present value that the distortion is manageable, they force a useful discipline around near-term retention, and they are auditable, you can actually verify them against real cohort data rather than projecting infinitely into the future.
| Dimension | What Most Brands Calculate | What Actually Matters |
|---|---|---|
Unit of Analysis |
Aggregate average across all customers. |
Cohort-level: acquisition month × channel × first product purchased. Trends are only visible at this level. |
Revenue Basis |
Gross revenue per customer. |
Contribution margin: gross revenue minus COGS, fulfillment, returns cost, and customer-level discount spend. |
Time Horizon |
"Lifetime", as reported by platform, often 36+ months projected. |
12-month and 24-month CM-LTV as primary metrics. Present-value anchored. Auditable against real cohort data. |
Channel Attribution |
Blended across acquisition sources. Single LTV figure applied everywhere. |
Channel-specific LTV by cohort. Paid social, organic, email referral, and influencer cohorts often have dramatically different retention profiles. |
Discount Handling |
Revenue counted at face value regardless of discount applied. |
Contribution margin calculation strips out discount spend. A customer with a 35% average discount rate has a fundamentally different CM-LTV. |
This is the work I do, with DTC brand operators scaling past $5M. If it's landing, the form takes two minutes.
How to calculate
LTV correctly.
This is not a theoretical framework. These are the steps. Run them in order. The output will look different from what your Shopify dashboard shows, and the difference is the information you've been missing.
Step 1: Define Your Cohorts
Group customers by acquisition month, acquisition channel (the channel that drove the first order), and first product category purchased. These are your three primary cohort dimensions. You don't need all three simultaneously at the start, begin with acquisition month, then layer in channel segmentation once you have the baseline framework running.
Step 2: Calculate Contribution Margin Per Order
For each order in a cohort's history: gross revenue minus COGS minus fulfillment cost per order minus return cost (allocate return cost to the order using your average return rate and average reverse fulfillment cost) minus the discount amount applied. This is your contribution margin per order. Sum these across all orders a cohort has placed in a given window and you have cohort CM.
Step 3: Calculate 12-Month and 24-Month CM-LTV by Cohort
Take the total contribution margin generated by each acquisition cohort within 12 months of their first purchase, divided by the number of customers in that cohort. That is your 12-month CM-LTV. Run the same calculation at 24 months. Plot both figures by cohort across time, you want to see whether each successive cohort's CM-LTV at the 12-month mark is improving, stable, or declining.
Step 4: Calculate Payback Period
Payback period = CAC divided by monthly contribution margin contribution per customer. If your CAC is $85 and your average customer contributes $12 of CM per month (based on purchase frequency and order CM), your payback period is approximately seven months. Anything beyond 12 months on payback is a significant risk signal for a DTC brand, it means you need to keep the business funded for a long time before new customers become positive contributors.
Step 5: Calculate LTV:CAC by Channel Cohort
Once you have CM-LTV at the 12-month and 24-month windows by acquisition channel, divide each by the CAC for that channel. This is your channel-level CM LTV:CAC ratio. These numbers will vary significantly across channels. That variation is the single most actionable output of the entire exercise.
These benchmarks are on a contribution margin basis, not gross revenue. Industry 3:1 on CM is meaningfully different from 3:1 on revenue. A brand reporting 3:1 on gross revenue with 40% contribution margins is actually running at 1.2:1 on a CM basis. That is a business with a structural problem, not a growth opportunity.
Getting the data
out of Shopify,
and where it falls short.
Shopify has native cohort analysis. You'll find it under Analytics > Reports > Customers > Customer cohort analysis. It shows you retention rates by acquisition month, what percentage of each cohort came back to purchase in subsequent months. It is genuinely useful as a starting point, and most brands have never looked at it.
What Shopify's cohort report shows: monthly purchase retention by cohort, with the ability to filter by sales channel. What it does not show: contribution margin at the cohort level, channel-level acquisition cost, return rates by cohort, or discount spend broken out by customer. It gives you the retention curve shape. The economic content of that curve is a separate exercise.
The Four Data Sources You Need to Join
Shopify cohort report: Purchase retention rates, purchase frequency, revenue by cohort. The baseline for timing and frequency data.
Klaviyo (or your ESP): Revenue attributed to email flows and campaigns by cohort. This matters because email-driven repurchase has a different cost profile than paid retargeting. Customers who reorder through email are genuinely higher-margin than customers who need a paid retargeting ad to come back. The right tech stack at each revenue tier determines how well you can actually execute and measure this.
Returns platform (Loop, Narvar, or your 3PL data): Return rate by cohort, return cost per order. This is the most commonly skipped data join. Brands will calculate LTV without knowing that their 2024-Q4 cohort (acquired heavily through a holiday discount) has a 28% return rate versus the 12% baseline for non-promotional cohorts.
Ad platform data: Channel-level CAC by acquisition month. Meta, Google, TikTok. You need the actual cost to acquire each cohort at the channel level to calculate the LTV:CAC ratio that matters, not a blended average.
"The manual join most brands avoid is connecting Shopify cohort retention to channel-level CAC and contribution margin. It takes a few hours to set up correctly. The brands that do it find out their acquisition strategy has been wrong for months."
The practical approach: build this in a Google Sheet or Looker Studio at first. Pull cohort-level revenue from Shopify, channel CAC from your ad platforms, email revenue contribution from Klaviyo, and return rates from your returns data. Join on customer acquisition month and channel. Calculate CM per cohort by subtracting COGS and order costs from cohort revenue. You'll have a working CM-LTV model within a day if the data is clean. If it's not clean, fixing the data hygiene is its own return on investment.
LTV benchmarks
by DTC category.
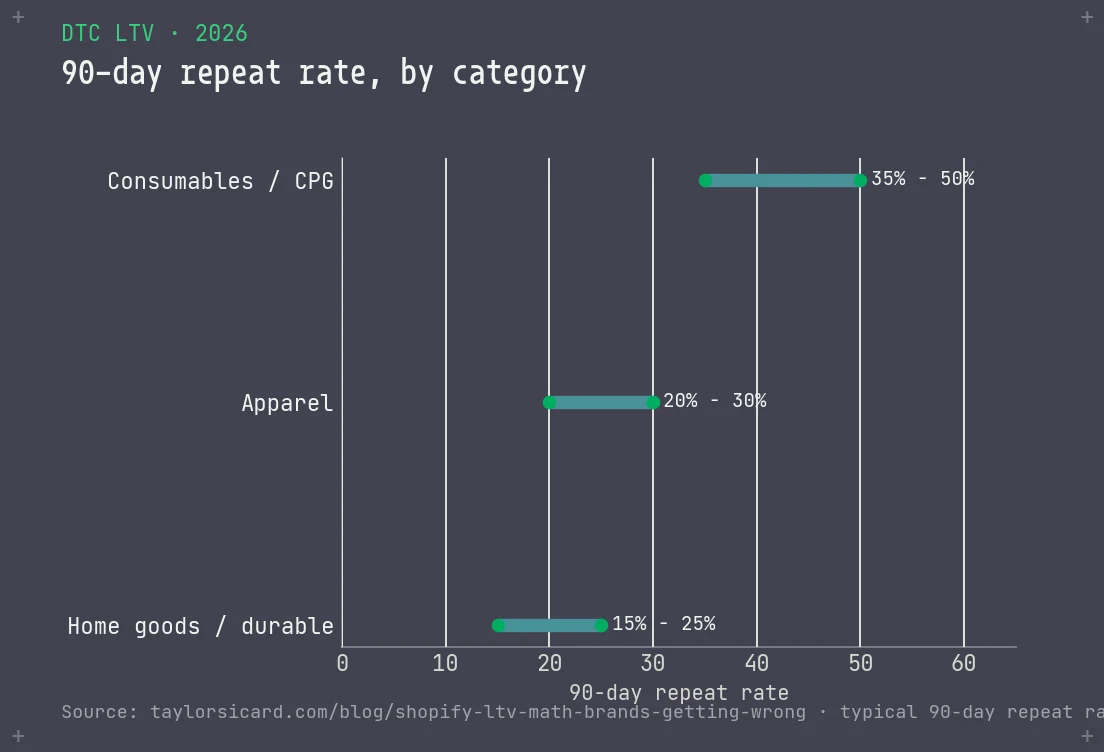
Category matters. A 4:1 CM-LTV:CAC ratio for an apparel brand is excellent. For a supplements brand with monthly replenishment cycles, 4:1 is underperforming. These benchmarks are reference points, not targets you set without understanding your own category economics.
| Category | Typical Repeat Rate | 12-Mo CM-LTV Target | Healthy LTV:CAC Range |
|---|---|---|---|
Consumables / CPG Supplements, skincare, food, coffee |
35–50% 90-day repeat. Strong monthly replenishment cycle if product delivers results. |
2.5–4× first-order CM. Frequency drives the multiple. Subscription conversion is the unlock. |
3.5:1 to 6:1. Strong replenishment economics push this higher with good retention. |
Apparel Mid-market and premium DTC |
20–30% 90-day repeat. Seasonal purchase patterns limit frequency. AOV elevation matters more than frequency. |
1.8–3× first-order CM. Lower purchase frequency means higher AOV and margin per order are the drivers. |
2:1 to 4:1. Return rates in apparel (often 20–28%) significantly impact CM-LTV. Model them correctly. |
Home Goods / Durables Furniture, lighting, décor |
15–25% 90-day repeat. Low purchase frequency. Brand equity and referrals drive a disproportionate share of second-order economics. |
1.5–2.5× first-order CM. Must include referral value in LTV estimate for high-equity brands. |
1.5:1 to 3:1. High AOV helps. Low frequency hurts. CAC must be controlled tightly. |
Subscription DTC Any category on subscription |
MRR-based model. Churn rate replaces purchase frequency. 3–5% monthly churn is the DTC subscription baseline. |
CM-LTV = monthly CM contribution divided by monthly churn rate. A $25/mo CM contribution at 4% churn = $625 LTV. Model it this way, not transactionally. |
3:1 to 6:1. Subscription crossed parity with SaaS unit economics at 4.1:1 in 2026. Retention is everything, a 1% churn reduction changes LTV by 20–30%. |
When the number
comes back worse
than you expected.
Run the corrected calculation and the result is below your CAC. What now?
First, separate the problem. Contribution LTV below CAC means you have an acquisition problem, a retention problem, a margin problem, or some combination of all three. They are not the same fix. An acquisition problem means you're paying too much for the wrong customers, solve it with channel mix and targeting. A retention problem means customers aren't coming back, solve it with post-purchase experience and loyalty infrastructure. A margin problem means COGS, discounting, or returns are destroying what should be profitable revenue, solve it with pricing discipline and returns rate management. If you're also evaluating working capital to fund growth through this period, understand that the cost of Shopify Capital compounds quickly when CM-LTV is already under pressure.
Second, look at channel-level CM-LTV:CAC. You almost certainly have channels that are positive and channels that are negative, and without the proper calculation, you probably don't know which is which. That split is usually where the growth ceiling actually sits, and reallocating against it is the channel-mix work a corrected number unlocks.
The most dangerous state for a DTC brand is running a positive aggregate LTV:CAC ratio while running a negative ratio on the majority of new acquisition. This happens when old, high-LTV cohorts are propping up the aggregate while newer cohorts (which reflect current economics) are negative. The business looks fine. The underlying trend is not.
Signs you're in this zone: aggregate LTV is stable but your most recent four cohorts show declining 90-day retention. CAC is rising YoY. Gross margin is holding but net margin is compressing. If three of these are true simultaneously, your aggregate LTV:CAC is misleading you about the state of the business.
The fix is not to scale acquisition harder. It is to stop, run the cohort-level CM-LTV correctly, and diagnose which part of the economics has deteriorated before deploying more capital.
"When we rebuilt the LTV model at WIN Brands properly (cohort-level, contribution margin basis) two paid channels that looked positive on ROAS became negative. One channel we had been consistently underspending showed 6:1 CM-LTV. That reallocation drove the majority of our profitable growth over the next 12 months."
This was not a marginal finding. We had been directing budget based on a metric (ROAS on gross revenue) that told a fundamentally different story than the metric that actually mattered. The channels that produced the best ROAS were also producing customers who purchased heavily on discount, returned at elevated rates, and didn't come back at the same frequency as customers from other channels. On revenue, they looked great. On contribution margin, cohorted at 12 months, they were a cash drain.
The channel we'd been underspending produced customers who paid full price more often, returned less, and had a 90-day second purchase rate 18 percentage points higher than our best-performing paid social channel. The CAC was slightly higher. The CM-LTV at 12 months was 6× that CAC. We had been leaving the most profitable acquisition channel underfunded because the surface-level metric didn't tell us it was the best one.
The single number
that tells you where
LTV is headed.
Building a full CM-LTV model takes time and requires 12 to 24 months of cohort history to be meaningful. You can not wait that long to know whether the customers you are acquiring right now will produce good returns. You need a leading indicator that tells you early (ideally within 90 days of the first purchase) whether a cohort is on track or not. While the cohort model builds, my free LTV and repeat rate calculator gives you the contribution-margin version of the number from a handful of inputs.
That indicator is second purchase within 90 days.
The data is clear on this. Roughly 62% of all repeat purchases happen within 90 days of the first order. The median time to second purchase across DTC is 45 days. Customers who come back within 90 days have a dramatically different long-term retention profile than customers who don't. Speed to second purchase is the strongest single predictor of long-term LTV, more predictive than first-order AOV, more predictive than acquisition channel in isolation, more predictive than the product category in most cases.
Brands with 35%+ 90-day second purchase rates compound their LTV over time. The customers come back faster, they tend to accept fewer discounts on subsequent orders, and they refer at higher rates. Brands below 25% typically struggle to reach 3:1 CM-LTV:CAC on a contribution basis, regardless of how well the acquisition side is running.
How to Use This as a Dashboard KPI
Build 90-day second purchase rate as a primary dashboard metric, not an afterthought in a retention report. Track it by cohort (acquisition month), by acquisition channel, and by first product purchased. When a new cohort's 90-day second purchase rate drops below your baseline, that is an early warning that either the acquisition targeting has drifted toward lower-quality buyers, or the post-purchase experience has degraded for that cohort's entry point.
The specific triggers to watch: if 90-day second purchase rate drops more than 5 percentage points versus the prior three cohorts, investigate immediately. If it drops more than 10 points, stop scaling acquisition from that cohort's primary channel until you understand the cause. The diagnosis is faster than you think when you have clean cohort data, it is usually one of three things: first-order experience quality, post-purchase email timing, or acquisition targeting that has drifted toward deal-seekers rather than brand buyers.
Shopify's Customer cohort analysis report will show you retention by month. Pull the percentage of each cohort that placed a second order in month 1 and month 2 combined. That is your 90-day second purchase rate. This is available natively, you do not need a third-party tool to start tracking it. You just need to look at the report and build the habit of reviewing it when you review any other acquisition metric. Pair this metric with a product page conversion audit, the two work together: one measures how well you're retaining buyers, the other measures how well you're converting them in the first place.
LTV is not a number on a dashboard. It is a statement about whether the economics of your business are working. The brands that get it right are not using more sophisticated software, they are asking a more honest question: what does a customer actually contribute after everything it costs to serve them? That question, answered at the cohort level, by channel, over a realistic time horizon, will tell you more about the health of your DTC brand than any other single piece of analysis.
Run the math. The answer will almost certainly surprise you. What you do with the surprise is what determines the next 12 months.
What is the most common LTV calculation mistake DTC brands make?
Using Shopify Analytics' "average order value times purchase frequency" figure as LTV without accounting for contribution margin. That revenue-based number overstates real LTV because it ignores COGS, fulfillment, returns, and payment fees. A brand showing $240 LTV on a revenue basis might have a true CM-basis LTV of $90 to $120, which changes every acquisition decision they make.
How do you calculate LTV correctly for a DTC brand?
Start with contribution margin per order (revenue minus COGS, fulfillment, payment fees, and returns), then multiply by average orders per customer over a defined 12 or 24 month window, adjusted for retention rate. Shopify's built-in reporting gives you order frequency but not contribution margin, so you pull the margin data from your P&L and apply it to cohort analysis. The number will almost always be lower than what your dashboard shows.
What is a good LTV:CAC ratio for a DTC brand?
On a contribution margin basis, 3:1 is the minimum for a sustainable DTC operation. 4:1 is good. 5:1 or above on CM is strong. The ratio must be calculated consistently: if your CAC is fully loaded (includes agency fees, creative, and ad spend), your LTV should also net out campaign-level costs. Mixing revenue-based LTV with fully-loaded CAC produces a ratio that looks better than it actually is.
What early metric best predicts long-term LTV?
Second purchase within 90 days. Customers who repurchase within 90 days of their first order have significantly higher lifetime order counts. A 35 percent or above 90-day repurchase rate is a strong signal retention is working. This is trackable natively in Shopify's cohort analysis report and is a leading indicator you can act on with targeted retention flows before the LTV data has time to mature. How well you convert new buyers in the first place, which drives into that 90-day cohort quality, is covered in the product page conversion audit.
How do I know if my LTV:CAC is being distorted by old cohorts?
Look at your four most recent acquisition cohorts' 90-day retention separately from the aggregate. If aggregate LTV:CAC looks stable but your last four cohorts show declining retention, old high-LTV cohorts are masking current economics. Three signals together indicate this state: aggregate LTV stable or growing; most recent cohort 90-day second purchase rate declining; CAC rising year over year. If all three are true, stop scaling acquisition and diagnose the cohort math first. For brands evaluating growth capital during this diagnostic, also review how Shopify Capital costs compound when CM-LTV is under pressure.
Getting the LTV math right quietly changes almost every spending decision downstream of it. Fixing it is core to the DTC brand consulting practice, and the form takes two minutes: start the conversation.
Scaling a consumer brand?
I work with a deliberately small number of DTC operators. I've run brands at this scale myself, from $5M past $100M. Not theory. If you're in that range, the form takes two minutes.
Start a conversation More about Taylor →