Between January 9, 2020 and September 10, 2026, 1045 earnings reports from 47 public companies are logged here, each with revenue and, where the company gave them, growth and guidance. 1043 link to the filing or release. The window is 27 calendar quarters of reporting, and the page makes no claim beyond it.
- Reports are grouped by the quarter they were published in, since fiscal calendars differ from company to company.
- 5 layers are covered, from ad platforms to the CPG majors.
What these
reports cover.
The tracker holds 1045 reports from 47 companies, published between January 9, 2020 and September 10, 2026. That is 27 calendar quarters of reporting. This page lists the latest report from each company and every report published in 2026. Each earlier year has its own page.
Reports from before 2026 come from each company's SEC filings or its own results releases. Where the source was a filing, growth is computed from the revenue the company reported a year earlier, so it can differ slightly from the growth figure in the company's release.
Fiscal years are each company's own. A fiscal second quarter can land in January for one company and in September for another, so the tables below group reports by the calendar quarter they were published in and show the fiscal year and quarter in separate columns.
1043 of the 1045 reports link to the filing or release they came from. Growth is as reported by the company, year over year. None of the 1045 reports has earnings per share recorded, so that figure is not shown.
The biggest public companies report the weather that smaller brands are about to operate in. Meta and Google tell you where CPMs are heading. Shopify and Klaviyo tell you which features are getting roadmap priority. Affirm and PayPal tell you how the consumer is actually spending. The public DTC brands are your closest comps, and the CPG majors are the acquirers. This tracker logs every earnings print since 2020 from that roster, with a plain read on what each one means for you.
It covers every reporting wave since 2020. The 2026 waves so far are the Q4 2025 and full-year reports released from late January through March, the Q1 2026 reports released from April through June, and the Q2 2026 reports landing from July into August. Every figure ties to the company's own investor-relations release or its SEC filing. The two sections below give the collective read on the current wave and the one before it; the five layer tables that follow give the company-by-company detail and the operator read on each. If you want to jump straight to the takeaways for a smaller brand, skip to what smaller brands should do.
The Q2 2026 read,
in three parts.
Reported from July into August, the Q2 2026 wave came down to one thing on the media side: reaching a customer got more expensive on every scaled platform at once. Meta's average price per ad rose 12% while impression growth thinned to 14% from 19% a quarter earlier, so the auction is clearing on price rather than on supply. Amazon's advertising line accelerated again to plus 26%, its third consecutive quarter of speeding up. The challengers stopped being a hiding place too. Snap's North American ARPU jumped 23% on a North American audience that shrank 7%, Pinterest's US and Canada ARPU rose 14% on 4% more users, and Reddit's US ARPU rose 51% on 6% more US users. Those are the same sentence written three ways. The platforms are monetizing the audience they already have far harder, because they are not finding many new people. The independent alternative did not participate. The Trade Desk grew 3%, missed the guidance it set in May, and guided Q3 below the quarter it had just finished, in the same fortnight that Amazon's ad line grew 26% and Reddit's grew 64%. That is budget consolidating into the walled gardens, so the open internet is not the cheap escape hatch from CPM inflation. Budget Q4 on higher CPMs everywhere, not just on Meta and Google.
Underneath the media story, a lot of very good-looking gross margins were not what they appeared. IEEPA tariff refunds landed in the June quarter and they are sitting inside the DTC margin lines. Warby Parker printed 57.9% against 53.0% a year ago, but roughly 500 basis points of that was an $11.8 million refund, which puts underlying gross margin at about 52.9%, essentially flat. There were 162 basis points of the same thing inside Revolve's 56.6%. At e.l.f., roughly 1,050 of 1,400 basis points of expansion came from refunds, and Toast booked about $10 million of it straight into adjusted EBITDA. None of that is pricing power and none of it repeats. Do the subtraction before you benchmark against any of these companies, then notice which ones raised guidance afterwards and which only reaffirmed it. FIGS is the one worth studying on that test. It booked the same kind of refund, worth about 780 of its 820 basis points of gross-margin expansion, but the quarter holds up without it. Net revenues grew 28.8%, active customers grew 13.2%, revenue per customer grew 10.1% and order value grew 8.5%, all in the same three months. Then it raised the full year and added $100 million to the buyback. The others needed the refund to make the margin line look like progress. FIGS put its progress in the demand metrics, where a refund cannot reach.
The last thread is that growth is increasingly purchased rather than earned. Celsius grew 11% while the CELSIUS brand itself shrank about 11.7%, with every point of growth coming from Alani Nu and Rockstar, both acquired, and gross margin down 340 basis points to carry them. Block's fastest-growing line was not payment processing at plus 13% but consumer lending originations at plus 59%. HubSpot added 14% more customers and only 4% more revenue per customer, with billings growing six points slower than revenue. Commerce.com's merchants grew GMV 14% while the platform's own revenue was flat. More often than not this quarter, the headline number and the engine underneath it pointed in different directions, which is exactly when a founder should be reading the segment tables instead of the press release.
"Tariff refunds made three DTC gross margins look like pricing power in the June quarter, and none of it repeats. Do the subtraction before you benchmark against anyone."
The Q1 2026 read,
the wave it built on.
The Q1 2026 wave, reported from April into June, set up everything above. Ad costs on the dominant platforms re-accelerated. Meta's average price per ad rose 12% year over year, up from 6% a quarter earlier, on top of 19% more impressions, and it raised full-year capex guidance to $125B to $145B to keep improving the auction. Amazon's advertising grew 24% to a business now over $70B on a trailing basis, and Google Search ads held plus 19% with management saying AI was adding queries rather than eating inventory. For a smaller brand, that means budgeting for higher CPMs on Meta, Google, and Amazon, not lower ones.
Underneath the price inflation, the consumer looked resilient but value-conscious. The BNPL names all grew volume in the low-to-mid 30s percent with benign credit, and both Affirm and Klarna described the consumer as financially healthy. But PayPal's branded checkout grew only 2%, and in packaged goods the food and beverage giants still grew almost entirely on price while volumes stayed flat to negative. The real volume recovery showed up in home and personal care, beauty, and health-positioned food: P&G returned to volume-led growth across all ten of its categories, Unilever's underlying volume jumped to plus 2.9%, and prestige beauty kept recovering on fragrance and China.
For the public DTC brands, Q1 was a lesson in fragility and discipline. Tariffs hit gross margins across hardgoods and apparel, and the winners defended margin with selective price increases and higher-margin mix rather than discounting, with On and FIGS actually raising guidance through it. The sharpest warning came from Oddity, whose revenue swung from plus 25% to minus 26% purely because one ad platform's acquisition cost roughly doubled. The durable brands leaned on retention (Chewy's 84% Autoship base) and channel mix (YETI's wholesale carrying a soft DTC quarter) rather than paid-traffic volume. That contrast, between brands that own their demand and brands that rent it, is the throughline of the whole wave.
"The Q1 2026 wave rewarded brands that own their demand and punished the ones that rent it. Oddity lost a quarter to a single ad platform. Chewy grew profit on a subscription base it controls."
The Q4 2025 and full-year reports before it, released from late January through March, are the baseline both waves extend. Ad-price inflation was already underway but milder, with Meta's price per ad up 6%. Reddit's ad revenue grew 75% and its ARPU 42%, the first sign of how fast a cheap channel reprices. Shopify posted its first quarter above $100B in GMV and framed 2026 around funding Catalog, Sidekick, and a Google-co-developed Universal Commerce Protocol so AI agents transact through its checkout rather than around it, while Klaviyo, Braze, and HubSpot all shipped AI agents into general availability with usage-based pricing. In packaged goods it was pricing-led and volume-flat: Mondelez grew on nearly 10% pricing while volumes fell almost 5%, and P&G's organic growth was zero. Every 2026 theme in this tracker was visible in those reports first.
Ad platforms:
who sets your CPMs.
These are the companies whose earnings calls move your cost of traffic. The pattern in 2026 is a split: the big three (Meta, Google, Amazon) are getting more expensive, funded by record AI capex that makes their auctions better-targeted and more competitive, while the challengers (Snap, Pinterest) stayed cheap and Reddit and AppLovin are the ones to watch. Each company's print is linked below to its filing.
| Company | Latest report | Revenue / YoY | Key signal | Operator read |
|---|---|---|---|---|
Meta (META) | Q2 · Jul 29 | $60.80B, +28% | Ad rev $59.4B +27%; price per ad +12%, impressions +14% (from +19% in Q1); op margin 31% vs 43%, capex $31.1B | Prices keep climbing while impression growth thins, so budget Q3 and peak on Meta CPMs at least 12% above Q2 2025 levels. The profit drop traces to $3.6B of legal and severance charges rather than weak ad demand |
Alphabet (GOOGL) | Q2 · Jul 22 | $119.8B, +24% | Search ads +17%, Cloud +82%; FY capex guide up to $205B | AI query growth keeps demand firm; budget firm CPMs, win on feed and creative |
Amazon (AMZN) | Q2 · Jul 30 | $200.6B, +20% | Ads $19.81B, +26%, re-accelerating from +24% in Q1; first $200B quarter; AWS $42.2B, +37%; operating income $27.5B, +43% | Retail-media cost is compounding faster than the retail business it sits on, and it sped up the same week Meta reported ad prices up 12% |
The Trade Desk (TTD) | Q2 · Aug 6 | $715.1M, +3% | Missed its own $750M guide; EBITDA margin 34% vs 39%; Q3 guided to $650M, below the quarter just printed | The open-internet DSP grew 3% while Amazon ads grew 26% and Reddit 64%, so budget is consolidating into the walled gardens |
AppLovin (APP) | Q2 · Aug 5 | $1.92B, +53% | Adjusted EBITDA $1.61B, +58%, an 84% margin against 81% a year ago; total costs and expenses only 22% of revenue; R&D $99.9M against $44.0M, more than double; free cash flow $863M; $551M of stock repurchased and withheld | An 84% EBITDA margin on 53% growth means AppLovin has no reason to discount, so treat it as a premium channel you qualify into and price the test accordingly. The Q3 margin guide steps down a point to 83% and R&D doubled, which is what the self-serve e-commerce push costs to run |
Pinterest (PINS) | Q2 · Aug 4 | $1.18B, +18% | MAU 640M, +11%, an all-time high; global ARPU still only $1.86; U.S. and Canada ARPU $8.30, +14%, on U.S. and Canada users up just 4%; adjusted EBITDA $311M, +24% | Still the cheapest scaled inventory of the three challengers, but the U.S. repricing has started and guidance decelerates to +13% to +15% for Q3. Book Q4 budget on today's economics, and note the user growth is landing in Rest of World at a $0.23 ARPU |
Snap (SNAP) | Q2 · Aug 3 | $1.60B, +19% | North America ARPU $10.26, +23%, while North America DAU fell 7% to 92M; global DAU 493M, +5%; adjusted EBITDA $250M vs $41M, after $128.5M of restructuring charges | Snap's growth now comes from repricing a shrinking home audience rather than reaching a bigger one, so the cheap-prospecting window is closing in the market your customers are in. The volume left is Rest of World at a $1.00 ARPU |
Reddit (RDDT) | Q2 · Jul 30 | $804.9M, +61% | US ARPU +51% on US users +6%; ad revenue +64% | The discount is closing fast, so lock in economics now and stop modelling Reddit search traffic as free demand |
The practical move is diversification before the challengers reprice. Meta and Google will keep taking price because their AI capex keeps making the inventory more valuable, so the offset is creative volume, first-party data, and a deliberate presence on the cheaper channels while they are still cheap. Before you raise a paid budget against these CPMs, pressure-test the unit economics: our free break-even ROAS calculator and max allowable CAC tool tell you what a rising CPM environment can actually support.
Commerce infrastructure:
what gets built next.
These earnings calls are the clearest read on which features your platforms will prioritize and where the upsell pressure is heading. The dominant 2026 theme is agentic commerce and AI-native tooling: Shopify is funding it hardest, and Klaviyo, Braze, and HubSpot are all shipping AI agents into production with usage-based pricing. The one laggard is Salesforce Commerce Cloud, flagged as a drag even as Agentforce crossed $1B in ARR.
| Company | Latest report | Revenue / YoY | Key signal | Operator read |
|---|---|---|---|---|
Shopify (SHOP) | Q2 · Aug 5 | $3.58B, +34% | GMV $115.6B, +32%; merchant solutions $2.78B, +37%, against subscription solutions $802M, +22%, so merchant solutions is now about 78% of revenue; operating income $488M, +68%; free cash flow $654M at an 18% margin; transaction and loan losses $141M, +76%, on a $2.18B loan and cash-advance book | Shopify's income is increasingly a take rate on your sales rather than a fee for your software, so model the platform bill as a variable cost of revenue. The loan book is the line to watch: if Shopify Capital gets offered to you, price the money against your own CAC payback |
Klaviyo (KVYO) | Q2 · Aug 5 | $370.6M, +26% | Customers above 205,000, but the cohort over $50,000 of ARR grew 36% to 4,477; NRR 109%; non-GAAP operating margin 14%, guided down to 10.5% to 11% in Q3 on SMS adoption and the Agency acquisition; full-year revenue raised to $1.526B to $1.534B | Klaviyo is being pulled upmarket, so expect agentic and multi-product tiers priced at the enterprise end first. Model your per-message SMS cost rising as you lean into the channel, because it is the line compressing Klaviyo's own margin |
Global-e (GLBE) | Q2 · Aug 12 | $299.0M, +39% | GMV $2.09B, +44%, so the blended take rate slipped to 14.3% from 14.8%; fulfillment services $159.6M is now 53% of revenue against service fees at $139.4M, pulling non-GAAP gross margin down 120bps to 45.3%; adjusted EBITDA $62.4M, +62%, at a 20.9% margin; sales and marketing spend fell to $35.8M from $44.0M; full-year guidance raised across GMV, revenue and EBITDA | Managed Markets 2.0 is live in Canada and the UK with every v1.0 merchant migrated, so the turnkey cross-border path inside Shopify checkout is real and building your own is harder to defend. Passport closed July 1, which means Global-e now owns the logistics leg it used to broker. Expect your shipping line to be repriced as an owned service, not a pass-through |
Braze (BRZE) | Q2 FY27 · Sep 8 | $227.2M, +26.2% | Professional services revenue more than doubled to $19.6M from $8.3M while subscription grew 21% to $207.7M, so services supplied about a quarter of the incremental revenue and pulled GAAP gross margin to 66.8% from 67.7%; net retention 110% against 108%; customers above $500K of ARR grew 28% to 361 against a total base up 15% to 2,789; non-GAAP operating income $22.0M against $6.0M; Q3 guided to $229M to $230M | Revenue grew 26% and gross margin still fell, and the revenue split explains why: heavier implementations are showing up as services work. Quote the implementation line separately when you price Braze, because it is real money. The Q3 guide sits about a point above the quarter just printed, so the deceleration is already in the number, and the upmarket concentration means less renewal leverage each year you stay |
HubSpot (HUBS) | Q2 · Aug 5 | $911.7M, +20% | Calculated billings $929.7M, +14%, six points slower than revenue; customers 306,446, +14%, but revenue per customer only +4% to $11,800; non-GAAP operating margin 20.3% against 17.0%; Q3 guided to +14% | Billings lead revenue, so the deceleration is already in the pipe. Growth is new logos rather than expansion, which means the pricing pressure sits on acquisition. Negotiate hard at signup, not at renewal |
Wix (WIX) | Q2 · Aug 4 | $563.1M, +15% | Bookings $569.1M, +12%, trailing revenue on named Partners softness; ARR $1.96B, +15%; Base44's own LLM takes its guided gross margin from near zero to about 60% in H2 | Owning the model turns AI compute into an engineering variable rather than a fixed tax. If you sell through agencies, the bookings gap is the number to watch |
Salesforce (CRM) | Q2 FY27 · Aug 26 | $11.3B, +11% | Informatica contributed $456M of revenue, a little over four points of the growth, so the organic line is closer to 7%; cRPO $33.5B, +14%, an acceleration; Agentforce and Data 360 ARR near $3.9B, +210%, with Agentforce ARR above $1.5B on a definition that now includes Slackbot and Headless 360; non-GAAP operating margin 34.1%; FY27 raised to $46.1B to $46.4B, with $200M of the $300M constant-currency raise coming from the pending Contentful and Fin deals | Four of the eleven points are Informatica, and most of the guidance raise is the pending Contentful and Fin deals rather than demand, so this is growth being bought. Commerce Cloud is the tell. It was flagged as a drag in each of the last three prints and goes unmentioned here, while the narrative all runs to Agentforce, Data 360 and Slack. That is where the roadmap money goes, so assume commerce features arrive late and price your stack for it |
Commerce.com (CMRC) | Q2 · Aug 6 | $84.5M, +0.1% | GMV $8.8B, +14%, while revenue was flat and subscription revenue fell 1%; ARR $360.5M, +2%; net revenue retention 95.8%, improving for a third straight quarter but still under 100%; second consecutive GAAP-profitable quarter. Guidance as of Aug 6 was superseded on Sep 10: an 8-K raised full-year non-GAAP operating income to $31.0M to $37.0M from $28.0M to $34.0M, reaffirmed revenue of $336.5M to $344.5M, and added a $50M buyback and a target of at least 20% operating margin from 2027 | The merchants are healthy and the platform is not capturing it. Profitable, but the profit came from cost rather than growth, so roadmap investment is funded out of margin. Price your migration option while you are choosing to, not having to |
Lightspeed Commerce (LSPD) | Q1 FY27 · Jul 30 | $322.7M, +6% (+17% organic) | GTV $25.7B and GPV $11.3B, +20% organic, lifting payments penetration to 44% of GTV from 40%; transaction revenue $214.5M against subscription revenue $95.4M; gross margin 43%; net loss narrowed to $2.4M from $49.6M; FY27 guided to $1.225B to $1.265B | Payments penetration is the number that matters to a merchant here, because the platform's economics now sit in the take rate rather than the subscription. If you are on Lightspeed, price the processing spread before you argue about the software fee |
Duolingo (DUOL) | Q2 · Aug 5 | $298.5M, +18.3% | Daily active users +23%, an acceleration from Q1, against monthly actives of 140.6M, +10%; bookings $289.1M; operating profit $33.9M and diluted EPS $0.66; the Q3 guide of $302M landed under a $303.9M consensus and took the stock down 11.1% after the close | A consumer-subscription comp rather than a brand, and the shape is the lesson: engagement compounding faster than audience is the healthiest thing a subscription can print. The market still paid for the guide, not the quarter |
The signal for a Shopify brand or app founder is that the roadmap budget is flowing to AI discovery, agentic checkout, B2B, and Markets. Wiring into those early aligns you with where the platform is investing rather than against it. For how this maps onto the broader stack a brand assembles as it scales, see the agentic commerce playbook for Shopify brands.
Payments and BNPL:
the real-time spend read.
Payments volume is the closest thing to a live feed on discretionary spending, and BNPL is the sharpest slice of it. The 2026 read is a healthy-but-selective consumer: the pay-over-time names grew volume in the low-to-mid 30s percent through the first half with benign credit, while the incumbent wallet and seller layer grew only modestly, a sign that growth is concentrated in financing-enabled purchases and new merchant supply, not broad per-customer expansion. Klarna's Q2 print is the first crack in that pattern, with volume growth slowing to 18% and the company pointing at German retail rather than at the consumer broadly. US volume in the same quarter still grew 27%, so read the deceleration as geographic. Affirm's FQ4 print on August 27 settled it: GMV grew 36% and revenue 33%, with GAAP operating margin doubling to 13%. The slowdown sat in Klarna's largest market, not in the method.
| Company | Latest report | Revenue / YoY | Key signal | Operator read |
|---|---|---|---|---|
Affirm (AFRM) | FQ4 · Aug 27 | $1.17B, +33% | GMV $14.06B, +36%, against Klarna at +18% two weeks earlier; GAAP operating margin 13% against 7% a year ago, adjusted 30%; net income $1.62B but $1,448M of that is a one-time tax benefit; active merchants 571K, +51%, against active consumers 27.8M, +21%; AOV fell to $266 from $276 while transactions per consumer rose to 7.0; 30+ delinquency 2.5% against 2.3%; Affirm Card GMV $2.84B, +124%; FY27 guide of more than $64B GMV implies growth slowing to roughly 28% | Affirm closed the Q2 wave by contradicting Klarna, so the softness Klarna blamed on Germany really was German. Ignore the headline net income. Operating margin doubling on the same business is the number that moved. For a brand, the mix shift matters more than either. Merchant supply is growing more than twice as fast as consumer demand, and falling AOV against rising purchase frequency says pay-over-time is turning into an everyday habit rather than a big-ticket financing decision. That makes it a frequency lever, and it should be priced like one |
Klarna (KLAR) | Q2 · Aug 18 | $1.04B, +27% | GMV $36.6B, +18% overall but +27% in the US; transaction margin dollars $446M, +42%, now 42.8% of revenue; credit provisions 0.52% of GMV; 120M active consumers, +8%, with revenue per consumer +24%; merchants 1.2M, +54%; full-year GMV guide cut to $149B to $151B on German softness while the transaction-margin guide was raised | Klarna cut volume and raised margin in the same release, and named Germany, not the consumer generally, as the reason. US volume still grew 27%. Treat it as a European demand signal and keep BNPL priced as an AOV lever, because margin per order is rising faster than orders |
Block (XYZ) | Q2 · Aug 5 | GP $3.17B, +25% | Consumer lending originations $18.9B, +59%, against Square GPV $72.8B, +13% (US +10%, International +28%); Cash App gross profit +31%; adjusted operating income $864M, a record 27% margin; full-year guidance raised | Block's fastest-growing line is lending consumers the money they spend, not processing more of it. If pay-over-time keeps growing four to five times faster than card volume, discretionary demand is increasingly credit-funded, which is fine until losses turn |
PayPal (PYPL) | Q2 · Jul 28 | $8.68B, +5% | TPV +10% to $486.4B but transaction margin fell to 44.9% from 46.4% | Volume is growing faster than the money made on it, so do not expect the wallet layer to carry your conversion rate |
Toast (TOST) | Q2 · Aug 4 | $1.91B against $1.55B | GPV $60.7B, +22%, on locations up 22% to roughly 180,000, so volume per restaurant is flat again; ARR $2.41B, +25%; adjusted EBITDA $221M including about $10M of one-time tariff refunds; full-year gross-profit guide raised to +23% to 25% | Toast is signing more restaurants, not seeing existing ones sell more. As the cleanest read here on discretionary out-of-home spend, flat per-location volume says the consumer is showing up but not trading up |
For a DTC brand, treat BNPL as a live conversion and average-order-value lever, because the data says financing-enabled purchases are where discretionary demand is actually growing, but do not assume the rising-tide checkout environment that PayPal's numbers say does not exist. One more data point for the backdrop: Stripe stayed private through 2026 but disclosed $1.9 trillion in 2025 payment volume, up 34%, so money is still moving at scale even with public-market payments multiples under pressure. In July it reportedly bid $53B for PayPal, and what a Stripe and PayPal merger would mean for your checkout and fees is the read that matters to a merchant.
Public DTC brands:
your closest comps.
These are the brands you can actually learn from, because they disclose the mechanics: gross margin, channel mix, marketing intensity, and how they are handling tariffs and paid acquisition. Three lessons run through the 2026 prints: tariffs are eating margin and the fix is pricing and mix, not discounting; single-channel acquisition is dangerous; and retention plus omnichannel is what separates the durable from the fragile.
The Oddity print is still the one to sit with, and it now has a full year behind it. A high-margin, high-repeat, 96%-DTC brand has spent four quarters shrinking because one ad partner's acquisition cost spiked, and it has just guided the fifth to roughly a 5% decline. That is the single-channel risk every DTC founder carries, measured across a year rather than a quarter, and it is the first step in how consumer brands actually shut down, which in 2026 is almost never weak demand and almost always a balance sheet that could not absorb a shock. Oddity could absorb it, and the receipt is on the balance sheet: cash down to $561M from $776M while it retired about a fifth of its own shares. The healthier models sit in the same table. Revolve raised marketing to 16.5% of sales to launch its own label and got 11% active-customer growth back for it, and Chewy runs an 84.6% Autoship base that grew faster than the company did. If you want the framework for which of these levers matters at your stage, the DTC growth inflection points piece maps it out.
CPG strategics:
demand and the acquirers.
The large CPG companies are two signals at once: a read on category demand, and the acquirers who might one day buy your brand. In 2026 the demand read split along category lines, with center-store food and beverage still growing on price while volumes stayed flat, and a real volume recovery in home and personal care, beauty, and health-positioned food. On the deal side, the majors kept buying niche, high-velocity brands.
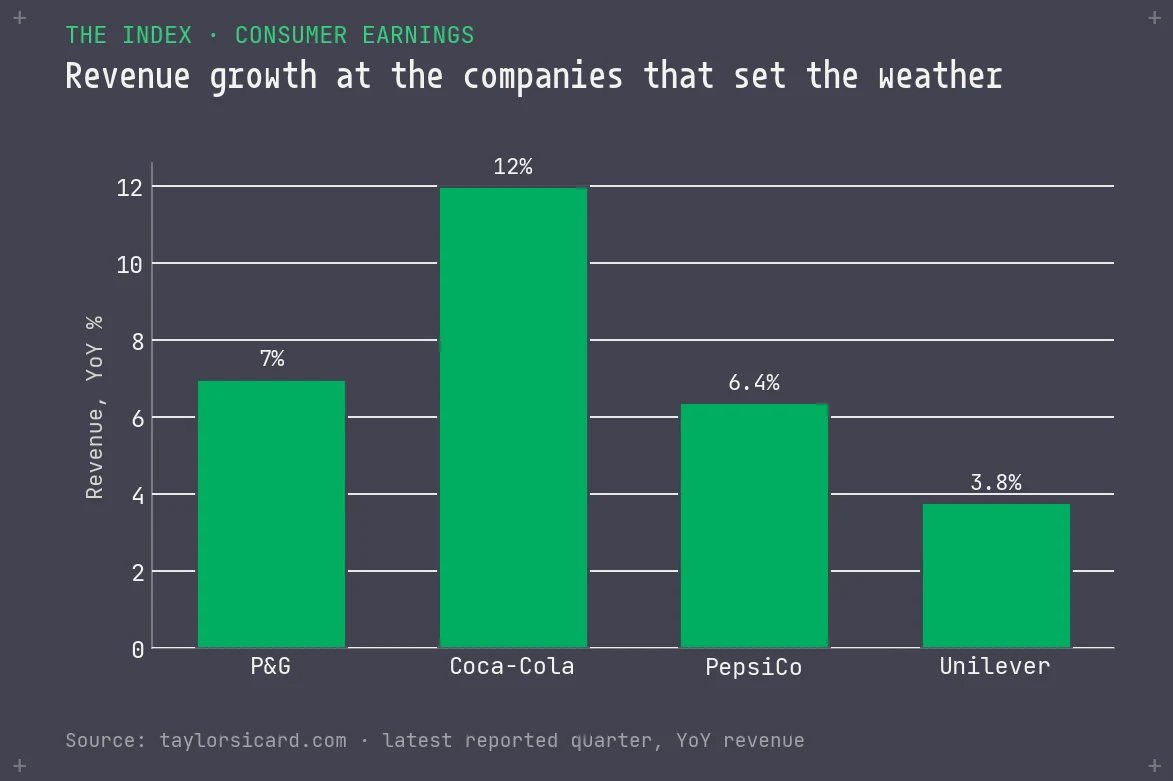
The M&A appetite is the part a founder should not miss. Church & Dwight said it plainly, that it is hunting "market-leading" fast-moving-consumable brands and paying up for high-velocity niche names, and PepsiCo, Estée Lauder, Unilever, and Colgate all bought growth in 2026. That is a live exit door for a scaled, growing DTC brand. For the deal-side view of who is buying and at what price, see the 2026 consumer M&A window explainer. The earlier stage of the same money flow, which brands private capital is backing before a strategic ever calls, is logged in the 2026 consumer raises, round by round.
What a smaller brand
should do with this.
The point of reading the majors is to act before the effect reaches you. These are the specific moves a smaller consumer brand should make off what these companies reported in 2026.
Budget for CPM inflation and diversify off it. Meta, Google, and Amazon are taking price and will keep doing so while their AI capex compounds, so model rising blended CPMs into your plan rather than hoping for a reversion. The offset comes from three things working together: creative volume, first-party data, and a deliberate, funded presence on the cheaper channels (Snap, Pinterest, and Reddit and AppLovin as they open) while they are still underpriced. For a brand that scaled straight through this cost environment, how IM8 grew to $200M in 19 months is worth studying, because it held $1.44 of gross profit for every $1 of CAC while doing it.
Adopt your platform's AI priorities early. Shopify is funding Catalog, Sidekick, and agentic checkout; Klaviyo and Braze are shipping AI agents. When a platform tells you where its roadmap budget is going, the features it names get the investment, the integrations, and eventually the ranking preference. Being early on agentic checkout and AI discovery is cheaper than being late.
Treat BNPL as a conversion and AOV lever, not a nice-to-have. The clearest growth in discretionary spend is running through pay-over-time, with healthy credit behind it. Offering Affirm, Klarna, or Afterpay at checkout is one of the few tailwinds the data actually supports, because the broad rising-tide checkout environment that PayPal's numbers rule out is not coming to rescue your conversion rate.
Build a gross-margin and sourcing cushion for tariffs. Every hardgoods and apparel brand in the comps ate a tariff hit to gross margin, and the ones that held up (On, FIGS) had the margin headroom to absorb it and the pricing power to pass some through. If your margin is thin and your sourcing is single-country, that is the exposure to fix before the next tariff headline, not after.
Go omnichannel and lead with retention. "DTC" now means omnichannel: YETI's wholesale carried a soft direct quarter, Warby and FIGS added stores, and e.l.f. leaned on retail shelf. The brands that held up did it on retention and subscription (Chewy) rather than paid-traffic volume, and owning your demand is the entire lesson of the Oddity print. To pressure-test where your own economics sit, the free Shopify store audit and the DTC growth scorecard are a fast starting point.
If you run paid media, start with the ad-platform table and the break-even ROAS tool before you set next quarter's budget. If you are on Shopify, read the infrastructure table for what to adopt next. If you are weighing a raise or an exit, read the CPG table for demand and acquirer appetite. The one-line version from the biggest brands: traffic is getting more expensive, the consumer is spending carefully, and owning your customer relationship matters more than it did.
IPO and S-1 watch.
New filings are their own signal: an S-1 is the first time a private brand's real numbers become public, and it resets the comp set. The table tracks the 2026 consumer and commerce IPO activity worth watching, updated as new filings and listings land.
| Company | Event | Detail | Status |
|---|---|---|---|
Oura Sep 3, amended Sep 21 · smart ring and health membership | S-1/A (Nasdaq: OURA) | Amendment No. 1 on September 21 set the terms the September 3 filing left blank. The base deal is 50,000,000 shares at an estimated $40 to $44, but the company is selling only 13,500,000 of them. Existing holders sell the other 36,500,000, and the 7,500,000-share underwriter option comes out of their stake too. That leaves Oura about $532.6M in net proceeds at the $42 midpoint. Against the 320,945,459 shares outstanding after the deal, the midpoint works out to roughly $13.5B of market value, $14.1B at the top of the range. Eli Lilly's $50.0M SAFE converts into 1,190,476 shares at closing. The financials are unchanged from the September filing: $1.21B of revenue for the nine months ended June 30, up 74%, split $974.0M hardware and $240.5M membership with membership up 121%, a 54.5% gross margin, and $60.8M of net income. Roughly 5.0 million paid members at June 30, double a year earlier. Existing holders are selling three quarters of the deal at a price above the $10.9B late-2025 Series E mark | Terms set |
Reformation Jul 30 · sustainable womenswear | IPO (NYSE: REF) | Priced 14,062,500 shares at $15.00 on July 29, the bottom of the $15 to $17 range, for $210.9M gross, split 9,478,821 primary and 4,583,679 secondary. Opened flat at the $15.00 issue price on its July 30 NYSE debut and closed the first session at $15.08, roughly an $890M market value against the ~$1B target floated at launch. FY25 revenue $507.1M and net income $12.6M, about 90% DTC, 70 stores across the US, UK, Canada and France | Public |
Shein Jul 10 · fast-fashion giant | Hong Kong IPO approved (CSRC) | China's securities regulator approved the Hong Kong listing: up to 341.6M shares (~8% of the company) at a $40B to $50B target valuation, possibly as early as Q3 with a 12-month completion deadline; caps a yearslong odyssey after UK and US attempts were blocked | Approved |
Tailored Brands Jul 10, amended Aug 31 · menswear retail | S-1/A (Nasdaq: MW) | Parent of Men's Wearhouse, Jos. A. Bank, K&G and Moores; ~$2.53B FY25 net sales across 1,006 stores; #1 in US menswear rental at an ~85% rental selling margin; Silver Point-controlled, its first return to public markets since the 2020 Chapter 11. Amendment No. 1 on Aug 31 changed the applied-for Nasdaq symbol from "MENW" to "MW", the old Men's Wearhouse ticker. Share counts and the price range are still blank, so terms are not set | Filed |
Jersey Mike's Subs Jul 30 · sandwich franchise | IPO (NYSE: JMKE) | Priced 43,478,261 shares at $23.00 on July 29, about $1.00B gross, with a 30-day option on 6,521,739 more from selling stockholders; the company issued 13,782,609 of those shares, roughly $317M, to repay debt and for general corporate purposes, and existing holders sold the other 29,695,652; S-1 effective July 29, first NYSE trade July 30, offering closed July 31; Blackstone-controlled, 3,300 locations and 99% franchised, with $4.3B systemwide sales and a $1.4M average unit volume | Public |
Stripe Feb 24 · payments | Secondary tender | Valued at $159B, up ~74%; 2025 payment volume $1.9T, +34%; no IPO or S-1 | Still private |
Suja Life May 6 · cold-pressed juice and soda | IPO (Nasdaq: SUJA) | Priced 8,888,889 Class A shares at $21.00, the low end of the $21 to $24 range, for ~$186.7M gross and ~$173.6M net; opened at $18.00 and closed the first day at $17.85, down 15%, a ~$689.5M market value. $326.62M FY2025 revenue against a $23.34M net loss; proceeds repaid $141.3M of borrowings, so a deleveraging listing rather than a growth raise | Public |
Once Upon a Farm Feb 5 · organic kids food | IPO (NYSE: OFRM) | Raised $197.9M at $18 per share and closed the first day at $21.05, up 17%, for a ~$847M market value at roughly 3.7x TTM revenue; 12x oversubscribed per Bloomberg despite a $48.1M net loss on $201.6M TTM revenue. The listing that reopened the consumer food IPO window | Public |
IEVA Group Mar 31 · French beauty and wellness | IPO (Euronext Growth Paris) | IOMA Paris, Atelier du Sourcil, myIEVA, My Little Paris; ~EUR 8M raise at EUR 12.79 per share, Bpifrance committed EUR 3M; EUR 43.4M 2025 revenue, plans a 2027 US entry by acquiring a premium beauty brand with $10M to $50M in sales | Public |
PayPay Feb · SoftBank payments app | IPO (Nasdaq: PAYP) | Filed F-1 in February, priced at $16 per ADS, began trading in March | Public |
BitGo Holdings Jan 22 · digital-asset custody | IPO (BTGO) | Priced at $18, raised $212.8M at roughly a $2B valuation; first digital-asset IPO of 2026 | Public |
Nutrabolt (C4) Jul · energy and sports nutrition | IPO prep | Picked underwriters for a US IPO targeting up to a $1B valuation | Rumored |
Skims; Alo Yoga rumored | IPO watch | Both widely rumored with no confirmed 2026 S-1; Alo prep read into its BELLA+CANVAS sale | Rumored |
Reformation is a result now rather than a filing, which makes it the more useful benchmark. A profitable, roughly 90% DTC apparel brand priced at the bottom of its range and opened flat. Public investors will take a healthy DTC P&L. They just will not pay a growth multiple for it, and at $15.00 the deal cleared at under 2x the $507.1M FY25 top line. Once Upon a Farm closed day one up 17%, Suja Life down 15%, and Reformation flat, which is roughly what an open but ungenerous window looks like from the inside. Tailored Brands finds out next what that window pays, having rebuilt out of a 2020 bankruptcy around a rental business running an 85% selling margin.
Jersey Mike's listed on July 30 at $23.00, the biggest of the three and the odd one out. It is a 3,300-store franchise system, so it collects royalties on stores its franchise owners paid to build. That is why $4.3B in systemwide sales runs through a company booking well under a billion of its own revenue. Reformation and Tailored Brands own their sales. Jersey Mike's owns the brand and lets operators fund the footprint.
Oura is the newest filing and the one worth reading closely if you sell a physical product. Hardware still does the heavy lifting at $974.0M of the nine-month revenue, but membership is the line that compounds: $240.5M, up 121%, against 74% growth overall. That is a hardware company getting a subscription to attach without surrendering its device margin, which is what most connected-product brands try and miss. The $924.3M figure on the common-stockholder line will get quoted as a loss. It is a $985.0M deemed dividend booked against preferred stock ahead of the listing, and the operating business made $71.2M over the same nine months.
How this tracker
is built.
Every figure here ties to a primary source: the company's own investor-relations press release, or its SEC filing (an 8-K, 10-Q, 6-K, or F-1). The links in the tables go to those documents, not to secondary coverage. Where a metric came from an earnings call rather than the release, it is treated as reported. Nothing is estimated or invented. If a number could not be verified against the company's own disclosure, it was left out.
That second sentence used to be aspirational. On September 18, 2026 I checked it the obvious way, by reading the link targets, and 18 of 86 pointed at trade press rather than at an issuer document. All 18 have been repointed at the company's own 8-K exhibit or results release. Two are on a corporate newsroom rather than EDGAR, because adidas and Beiersdorf are not SEC registrants and have no EDGAR filing to point at. The sweep also caught two report dates that were a day or two off the release, now corrected to Sprouts on July 29 and Beiersdorf on August 3, and one row that should never have existed: Olaplex was shown with a Q2 print it never made, because Henkel took it private on July 7 and the row had been built from a scheduled earnings date that calendar sites never retracted. That row now records the take-private instead. Replacing 18 links is more work than rewriting one sentence, which is the reason to do it that way round: softening the claim would have removed the problem from view without removing it.
Each row's guidance is true as of that row's report date, not as of today, and companies revise outlooks between prints at investor days and in Item 7.01 filings. Those events have no quarter and no revenue figure, so they do not fit a row keyed on a reporting period, and they used to have nowhere to live. They are now tracked separately in the ledger, and where one supersedes a table cell the row says so and names the date. Commerce.com is the live example: its August 6 guidance was raised on September 10.
The window covers every reporting wave since 2020. The 2026 waves so far are the Q4 2025 and full-year reports released from late January through March, the Q1 2026 reports released from April through June, and the Q2 2026 reports landing from July into August. Fiscal calendars vary, so some companies report offset quarters (Affirm's fiscal year ends in June, e.l.f.'s and Estée Lauder's in June or March, Salesforce and Braze on a January year-end, the European CPG names on half-year and quarterly trading updates), and each row notes the actual period. The "operator read" column is my own interpretation of what each print means for a smaller brand, not the company's guidance.
This page is refreshed daily. As new earnings prints and S-1 filings land, they are added to the tables and the collective reads are updated, and the underlying data lives in a maintained ledger alongside the 2026 consumer M&A and funding tracker. The Q2 wave is complete. Q3 begins reporting in October, so the tables will fill out again through late October and November. If a company you care about is missing, it is either outside the consumer-brand-weather roster or it had not reported inside the window, not an oversight.
The latest report
from each company.
One line per company, its most recent report, grouped by layer: 47 companies in all.
| Company | Quarter | Reported | Revenue | Growth | Guidance | Source |
|---|---|---|---|---|---|---|
AlphabetGOOGL · Ad platforms | FY2026 Q2 | July 22, 2026 | $119.8B | +24% | FY26 capex guide raised to $195B to $205B (from ~$185B); Q2 capex $44.9B | sec.gov |
AmazonAMZN · Ad platforms | FY2026 Q2 | July 30, 2026 | $200.61B | +20% | Q3'26 net sales $197.0B to $202.0B, +9% to +12%, and nearly 400bps higher excluding the Prime Day timing shift in both years, with an FX headwind of roughly 80bps; Q3 operating income $22.5B to $26.5B vs $17.4B | businesswire.com |
AppLovinAPP · Ad platforms | FY2026 Q2 | August 5, 2026 | $1.92B | +53% | Q3'26 revenue $2,055M to $2,085M, which is 7% to 8% sequential growth off the Q2 base; Q3 adjusted EBITDA $1,710M to $1,740M at an 83% margin | s21.q4cdn.com |
MetaMETA · Ad platforms | FY2026 Q2 | July 29, 2026 | $60.8B | +28% | Q3'26 revenue $61B to $64B with FX about a 1-point headwind; FY26 total expenses raised at the low end to $165B to $169B to absorb the legal charges; FY26 capex narrowed to $130B to $145B (from $125B to $145B); tax rate 15% to 17% for the remaining quarters; still expects FY26 operating income above 2025 | investor.atmeta.com |
PinterestPINS · Ad platforms | FY2026 Q2 | August 4, 2026 | $1.18B | +18% | Q3'26 revenue $1,190M to $1,210M, +13% to +15%, assuming a modest FX headwind; Q3 adjusted EBITDA $335M to $355M | sec.gov |
RedditRDDT · Ad platforms | FY2026 Q2 | July 30, 2026 | $804.9M | +61% | Q3'26 revenue $860M to $870M; Q3 adjusted EBITDA $385M to $395M | sec.gov |
SnapSNAP · Ad platforms | FY2026 Q2 | August 3, 2026 | $1.6B | +19% | Q3 2026 outlook given on the earnings call and in the investor letter, not in the release | sec.gov |
The Trade DeskTTD · Ad platforms | FY2026 Q2 | August 6, 2026 | $715.1M | +3% | Q3'26 revenue at least $650M, which is below the $715M just delivered, and adjusted EBITDA of approximately $160M, implying a margin near 25% against the 34% just printed | investors.thetradedesk.com |
| Company | Quarter | Reported | Revenue | Growth | Guidance | Source |
|---|---|---|---|---|---|---|
Church & DwightCHD · CPG strategics | FY2026 Q2 | July 31, 2026 | $1.53B | +1.6% | FY26 RAISED across the board: net sales flat to +1% (from -1.5% to -0.5%), organic +4% to +5% (from +3% to +4%), adjusted gross margin expansion roughly 100 to 120bps, reported EPS +20% to +22%, adjusted EPS +6% to +8% (from +5% to +8%), operating cash flow about $1.175B (from $1.150B). Marketing at or above 11% of sales. Q3 guide: organic +3%, reported sales -1%, marketing about 12% of sales, adjusted EPS about $0.89 | sec.gov |
Coca-ColaKO · CPG strategics | FY2026 Q2 | July 28, 2026 | $13.4B | +7% | FY26 raised: organic ~5% (from 4-5%), comparable cc EPS ex-M&A 7-8%, comparable EPS 9-10%, FCF ~$12.4B | |
ColgateCL · CPG strategics | FY2026 Q2 | July 31, 2026 | $5.36B | +4.9% | FY26 net sales still +2% to +6% and organic still +1% to +4%. Gross margin guidance RAISED from down to roughly flat on both GAAP and Base Business. Base Business EPS growth raised to mid-single-digit from low-to-mid; GAAP still double-digit | investor.colgatepalmolive.com |
Conagra BrandsCAG · CPG strategics | FY2026 Q4 | July 15, 2026 | $2.88B | +3.6% | FY27 organic net sales -3% to -1% | conagrabrands.com |
DanoneBN · CPG strategics | FY2026 H1 | July 29, 2026 | $15.05B | +3.5% | FY26 confirmed: LFL sales growth +3% to +5% with recurring operating income growing faster than sales | globenewswire.com |
Estee LauderEL · CPG strategics | FY2026 Q4 | August 19, 2026 | $3.63B | +6% | FY27 organic net sales +3% to +5%; adjusted operating margin raised to 12.7% to 13.5% from the preliminary 12.5% to 13.0% given in May; adjusted diluted EPS $3.10 to $3.35; adjusted effective tax rate 33% to 34%; operating cash flow $1.3B to $1.4B; capex about 4% of sales; quarterly dividend held at $0.35 | sec.gov |
KenvueKVUE · CPG strategics | FY2026 Q2 | August 6, 2026 | $3.96B | +3% | None. Kenvue is not providing forward-looking guidance and held no earnings call because of the pending Kimberly-Clark transaction, which the release says is expected to close in the fourth quarter of 2026 | kenvue.com |
Mondelez InternationalMDLZ · CPG strategics | FY2026 Q2 | July 28, 2026 | $9.36B | +4.1% | FY26 organic raised to at least 2%; adjusted EPS growth held flat to +5% cc; FY FCF ~$3B | |
NestleNSRGY · CPG strategics | FY2026 H1 | July 23, 2026 | $48.27B | +3.6% | FY26 reaffirmed: organic ~3% to 4% with accelerating RIG, UTOP margin to improve vs 2025 | nestle.com |
PepsiCo (PEP)PEP · CPG strategics | FY2026 Q2 | July 9, 2026 | $24.18B | +6.4% | FY26 maintained organic +2% to +4%, core cc EPS +4% to +6% | investor.pepsico.com |
Procter & GamblePG · CPG strategics | FY2026 Q4 | July 29, 2026 | $21.2B | +2% | FY27 all-in and organic sales growth both +1% to +3% (including a 30 to 50 bps drag from brand and go-to-market discontinuations); FY27 diluted EPS +1% to +5%, core EPS in-line to +3% ($6.89 to $7.11); ~$1B after-tax commodity, energy and freight headwind plus $350M from interest, non-operating income and FX, a combined $0.56 per share or an 8-point drag on core EPS; capex 4.5% to 5.5% of sales; ~$10B dividends and ~$5B buyback | pginvestor.com |
Reynolds Consumer ProductsREYN · CPG strategics | FY2026 Q2 | July 29, 2026 | $944M | +0.6% | FY26 net revenues raised to +1% to +3% to account for increased pricing net of elasticity; FY26 net income and adjusted net income held at $331M to $343M, EPS and adjusted EPS $1.57 to $1.63, Adjusted EBITDA $660M to $675M; Q3 revenues approximately flat vs $931M, Q3 EPS $0.37 to $0.39, Q3 Adjusted EBITDA $160M to $165M; dividend held at $0.23 | investors.reynoldsconsumerproducts.com |
The Hershey CompanyHSY · CPG strategics | FY2026 Q2 | July 30, 2026 | $2.79B | +6.6% | FY26 narrowed UP: net sales +4.5% to 5% (from 4% to 5%), organic +3% to 3.5% (from 2.5% to 3.5%), reported EPS growth 82% to 89%, adjusted EPS growth 32.5% to 35%, adjusted EPS $8.36 to $8.52; tax rate 25% to 27%, interest expense $200M to $210M, capex $425M to $475M, roughly $100M of Advancing Agility & Automation savings; excludes potential future tariff rebates | prnewswire.com |
UnileverUL · CPG strategics | FY2026 H1 | July 28, 2026 | $27.65B | +0.5% | FY26 upgraded: USG within the 4% to 6% multi-year range with ~3% underlying volume growth (up from ~2%), H2 USG 4% to 5% led by pricing, modest underlying operating margin improvement vs 20.0% in 2025 | unilever.com |
| Company | Quarter | Reported | Revenue | Growth | Guidance | Source |
|---|---|---|---|---|---|---|
BrazeBRZE · Commerce infrastructure | FY2027 Q2 | September 8, 2026 | $227.2M | +26.2% | Q3 FY27 revenue $229.0M to $230.0M with non-GAAP operating income $16.0M to $17.0M; FY27 revenue $910.0M to $913.0M, non-GAAP operating income $75.5M to $76.5M and non-GAAP diluted EPS $0.64 to $0.65. Forge 2026 customer conference Sept 28 to 30 in Las Vegas | sec.gov |
Commerce.comCMRC · Commerce infrastructure | FY2026 Q2 | August 6, 2026 | $84.5M | +0.1% | Q3'26 revenue $82.5M to $85.5M; Q3 non-GAAP operating income $3.3M to $5.3M. FY26 revenue $336.5M to $344.5M; FY26 non-GAAP operating income $28.0M to $34.0M | sec.gov |
Global-eGLBE · Commerce infrastructure | FY2026 Q2 | August 12, 2026 | $299M | +39% | Q3'26 GMV $1,995M to $2,045M, revenue $308.5M to $315.5M, adjusted EBITDA $58.5M to $62.5M. FY26 raised across every metric: GMV $8,810M to $9,110M from $8,530M to $8,880M, revenue $1,305M to $1,355M from $1,220M to $1,280M, adjusted EBITDA $278M to $300M from $264.5M to $289.5M. Passport expected to add $55M to $59M of H2 revenue and $3M to $4M of adjusted EBITDA | globenewswire.com |
HubSpotHUBS · Commerce infrastructure | FY2026 Q2 | August 5, 2026 | $911.7M | +20% | Q3'26 revenue $924.0M to $925.0M, +14% as reported and +15% constant currency; Q3 non-GAAP operating income $187.0M to $188.0M at a 20% margin; Q3 non-GAAP EPS $3.25 to $3.27. FY26 revenue $3.678B to $3.686B, +18% as reported and +16% constant currency; FY26 non-GAAP operating income $762.0M to $766.0M at a 21% margin; FY26 non-GAAP EPS $13.23 to $13.31 | sec.gov |
KlaviyoKVYO · Commerce infrastructure | FY2026 Q2 | August 5, 2026 | $370.6M | +26% | Q3'26 revenue $377M to $381M, growth of 21.5% to 22.5%; Q3 non-GAAP operating income $40M to $43M at a 10.5% to 11% margin. FY26 raised to $1,526M to $1,534M, growth of 24%; FY26 non-GAAP operating income $212M to $218M at a 14% margin | sec.gov |
SalesforceCRM · Commerce infrastructure | FY2027 Q2 | August 26, 2026 | $11.3B | +11% | Q3 FY27 revenue $11.42B to $11.5B (+11% to +12%) and Q3 cRPO growth of roughly 14%, excluding the pending deals. FY27 revenue raised to $46.1B to $46.4B (+11% to +12%), a $200M raise, $300M in constant currency, of which $100M is organic and $200M is the pending Contentful and Fin acquisitions, against a $100M FX headwind. FY27 non-GAAP operating margin held at 34.3%, GAAP updated to 20.1%, operating and free cash flow growth held at roughly 4% to 5% | salesforce.com |
ShopifySHOP · Commerce infrastructure | FY2026 Q2 | August 5, 2026 | $3.58B | +34% | Q3'26 revenue growth low-thirties percent; gross profit dollars mid-to-high twenties percent; operating expenses 33% to 34% of revenue; stock-based compensation $150M; free cash flow margin high-teens to low-twenties | globenewswire.com |
WixWIX · Commerce infrastructure | FY2026 Q2 | August 4, 2026 | $563.1M | +15% | FY26 maintained: revenue growth low to mid teens, bookings low teens, FCF margin high teens excluding acquisition and restructuring costs; Q3 revenue growth low double digits; Base44 non-GAAP gross margin guided to roughly 60% in H2 from near zero entering the year | globenewswire.com |
| Company | Quarter | Reported | Revenue | Growth | Guidance | Source |
|---|---|---|---|---|---|---|
AffirmAFRM · Payments and BNPL | FY2026 Q4 | August 27, 2026 | $1.17B | +33% | FQ1'27 GMV $13.70B to $14.00B, revenue $1,190M to $1,220M, RLTC $575M to $590M, GAAP operating margin 11.5% to 13.5%, adjusted operating margin 28.0% to 30.0%. FY27 GMV more than $64B, revenue about 8.5% of GMV, RLTC as a percent of GMV similar to FY26, adjusted operating margin more than 30.5%, GAAP operating margin more than 14.5% | sec.gov |
BlockXYZ · Payments and BNPL | FY2026 Q2 | August 5, 2026 | $6.62B | Q3'26 gross profit $3.13B, +18%; Q3 adjusted operating income $875M at a 28% margin; Q3 adjusted diluted EPS $1.02, +89%. FY26 gross profit $12.51B, +21%; FY26 adjusted operating income $3.47B at a 28% margin, growing 67%; FY26 adjusted diluted EPS $4.02, +70% | sec.gov | |
KlarnaKLAR · Payments and BNPL | FY2026 Q2 | August 18, 2026 | $1.04B | +27% | FY26 GMV cut to $149B to $151B from greater than $155B, on roughly $600M of currency translation and a more measured view of German volumes; FY26 revenue $4.08B to $4.16B, partly reflecting a move to fair value accounting on new US and German Fair Financing originations; FY26 transaction margin dollars raised to $1.62B to $1.65B from greater than $1.61B; FY26 adjusted operating income $280M to $300M. Q3'26 GMV $35B to $36B, revenue $940M to $980M, TMD $340M to $360M, adjusted operating income $5M to $15M | s205.q4cdn.com |
PayPalPYPL · Payments and BNPL | FY2026 Q2 | July 28, 2026 | $8.68B | +5% | FY26 non-GAAP EPS raised to ~$5.38 (from low-single-digit decline to slightly positive); FY26 GAAP EPS reaffirmed at a mid-single-digit decline; Q3'26 GAAP and non-GAAP EPS both a low-single-digit decline | sec.gov |
ToastTOST · Payments and BNPL | FY2026 Q2 | August 4, 2026 | $1.91B | Q3'26 non-GAAP subscription and fintech gross profit $615M to $625M, growth of 22% to 24%; Q3 adjusted EBITDA $210M to $220M. FY26 non-GAAP subscription and fintech gross profit $2,325M to $2,355M, growth of 23% to 25%, raised from 21% to 23%; FY26 adjusted EBITDA $805M to $825M, raised from $790M to $810M | sec.gov |
| Company | Quarter | Reported | Revenue | Growth | Guidance | Source |
|---|---|---|---|---|---|---|
CelsiusCELH · Public DTC brands | FY2026 Q2 | August 6, 2026 | $817.9M | +11% | None. The release contains no forward guidance or outlook section | ir.celsiusholdingsinc.com |
ChewyCHWY · Public DTC brands | FY2026 Q2 | September 9, 2026 | $3.33B | +7.3% | CEO Sumit Singh said the quarter gives Chewy "confidence to raise our full-year revenue and profitability outlook", with the specific figures given on the call rather than in the release | sec.gov |
FIGSFIGS · Public DTC brands | FY2026 Q2 | August 6, 2026 | $196.6M | +28.8% | FY26 net revenues growth of approximately 20% against 2025, raised; FY26 adjusted EBITDA margin 14.8% to 15.0% | sec.gov |
Oddity TechODD · Public DTC brands | FY2026 Q2 | September 9, 2026 | $180.5M | -25% | Q3 2026 net revenue to decline about 5% year over year with adjusted EBITDA of $18M to $20M. FY2026 net revenue to decline about 19% with adjusted EBITDA of $30M to $32M | globenewswire.com |
On HoldingONON · Public DTC brands | FY2026 Q2 | August 11, 2026 | $952.34M | +13.5% | FY26 constant currency net sales growth in the low-20% range, implying CHF 3.47B to CHF 3.56B at current spot rates; FY26 gross profit margin raised to at least 65.0%; adjusted EBITDA margin reiterated at 19.5% to 20.0%; excludes any benefit from anticipated second-half tariff refunds | press.on-running.com |
Once Upon a Farm, PBCOFRM · Public DTC brands | FY2026 Q2 | August 6, 2026 | $85.4M | +42.3% | FY2026 net sales $327M to $335M, growth of 36% to 39% versus 2025; adjusted EBITDA $3M to $4.5M. Both were raised, per the release headline; the prior ranges are not restated in the document, so the size of the raise is not derivable. Guidance as of 2026-08-06, the release's own stated basis date | sec.gov |
Reformation (NYSE: REF)REF · Public DTC brands | FY2026 Q2 | September 10, 2026 | $155.2M | +24.1% | FY2026 net revenue $602M to $606M, approximately +18.6% to +19.5%; adjusted EBITDA margin 14.0% to 14.2%; capex $23M to $27M against 15 to 16 planned new stores | sec.gov |
RevolveRVLV · Public DTC brands | FY2026 Q2 | August 4, 2026 | $347.4M | +12% | Q3'26 and FY26 gross margin 53.5% to 54.0%, assuming no further IEEPA refunds; Q3 marketing 15.8% to 16.0% of net sales and FY26 15.3% to 15.8%; Q3 selling and distribution 17.1% to 17.3% and fulfillment 3.2% to 3.4% | prnewswire.com |
Suja Life, Inc.SUJA · Public DTC brands | FY2026 Q2 | August 4, 2026 | $83.9M | +11.6% | FY2026 (year ending Dec 28) net sales $360M to $369M, growth of 10.2% to 13.0% against $326.6M in fiscal 2025; adjusted EBITDA $70M to $72M, growth of 72.8% to 77.7% against $40.5M, "consistent with prior expectations"; base tax rate 26.1%. Guidance as of 2026-08-04. The framing is "updating its outlook... reflecting near-term softness concentrated in the grocery channel", so the revision was sales-only and EBITDA was explicitly held; the prior sales range is not restated, so the size of the cut is not derivable. Superseded in part on 2026-08-20: see the guidance events tab | sec.gov |
Warby ParkerWRBY · Public DTC brands | FY2026 Q2 | August 6, 2026 | $235.5M | +9.8% | FY26 reaffirmed rather than raised: net revenue $959M to $976M, growth of approximately 10% to 12%; adjusted EBITDA $117M to $119M, a 12.2% margin and roughly 130bps of expansion, including a full-year $14.4M tariff-refund benefit; 50 new store openings; excludes any revenue or halo contribution from Intelligent Eyewear | sec.gov |
YETIYETI · Public DTC brands | FY2026 Q2 | August 13, 2026 | $483.9M | +9% | FY26 sales growth maintained at 7% to 8%; adjusted operating margin raised to 14.9% from 14.6%; adjusted EPS raised to $2.94 to $3.00 (+19% to 21%) from $2.83 to $2.89; capex $60M to $70M and free cash flow $200M to $225M unchanged; outlook assumes US tariff rates return to roughly 20% in H2; Investor Day September 17 in Austin | investors.yeti.com |
e.l.f. BeautyELF · Public DTC brands | FY2027 Q1 | August 5, 2026 | $479.4M | +36% | FY27 outlook raised: net sales $1,938M to $1,968M from $1,835M to $1,865M, an expected 18% to 20% increase against 12% to 14% previously; adjusted EBITDA $401M to $407M from $379M to $385M; adjusted net income $212M to $215M; adjusted diluted EPS $3.50 to $3.55; adjusted tax rate 25% to 26% on 60.5M weighted average diluted shares. No quarterly guidance given | sec.gov |
Every report published
in 2026, by quarter.
The 132 reports published in 2026, newest first, in the calendar quarter they were published.
| Company | Quarter | Reported | Revenue | Growth | Guidance | Source |
|---|---|---|---|---|---|---|
Reformation (NYSE: REF)REF · Public DTC brands | FY2026 Q2 | September 10, 2026 | $155.2M | +24.1% | FY2026 net revenue $602M to $606M, approximately +18.6% to +19.5%; adjusted EBITDA margin 14.0% to 14.2%; capex $23M to $27M against 15 to 16 planned new stores | sec.gov |
ChewyCHWY · Public DTC brands | FY2026 Q2 | September 9, 2026 | $3.33B | +7.3% | CEO Sumit Singh said the quarter gives Chewy "confidence to raise our full-year revenue and profitability outlook", with the specific figures given on the call rather than in the release | sec.gov |
Oddity TechODD · Public DTC brands | FY2026 Q2 | September 9, 2026 | $180.5M | -25% | Q3 2026 net revenue to decline about 5% year over year with adjusted EBITDA of $18M to $20M. FY2026 net revenue to decline about 19% with adjusted EBITDA of $30M to $32M | globenewswire.com |
BrazeBRZE · Commerce infrastructure | FY2027 Q2 | September 8, 2026 | $227.2M | +26.2% | Q3 FY27 revenue $229.0M to $230.0M with non-GAAP operating income $16.0M to $17.0M; FY27 revenue $910.0M to $913.0M, non-GAAP operating income $75.5M to $76.5M and non-GAAP diluted EPS $0.64 to $0.65. Forge 2026 customer conference Sept 28 to 30 in Las Vegas | sec.gov |
AffirmAFRM · Payments and BNPL | FY2026 Q4 | August 27, 2026 | $1.17B | +33% | FQ1'27 GMV $13.70B to $14.00B, revenue $1,190M to $1,220M, RLTC $575M to $590M, GAAP operating margin 11.5% to 13.5%, adjusted operating margin 28.0% to 30.0%. FY27 GMV more than $64B, revenue about 8.5% of GMV, RLTC as a percent of GMV similar to FY26, adjusted operating margin more than 30.5%, GAAP operating margin more than 14.5% | sec.gov |
SalesforceCRM · Commerce infrastructure | FY2027 Q2 | August 26, 2026 | $11.3B | +11% | Q3 FY27 revenue $11.42B to $11.5B (+11% to +12%) and Q3 cRPO growth of roughly 14%, excluding the pending deals. FY27 revenue raised to $46.1B to $46.4B (+11% to +12%), a $200M raise, $300M in constant currency, of which $100M is organic and $200M is the pending Contentful and Fin acquisitions, against a $100M FX headwind. FY27 non-GAAP operating margin held at 34.3%, GAAP updated to 20.1%, operating and free cash flow growth held at roughly 4% to 5% | salesforce.com |
Estee LauderEL · CPG strategics | FY2026 Q4 | August 19, 2026 | $3.63B | +6% | FY27 organic net sales +3% to +5%; adjusted operating margin raised to 12.7% to 13.5% from the preliminary 12.5% to 13.0% given in May; adjusted diluted EPS $3.10 to $3.35; adjusted effective tax rate 33% to 34%; operating cash flow $1.3B to $1.4B; capex about 4% of sales; quarterly dividend held at $0.35 | sec.gov |
KlarnaKLAR · Payments and BNPL | FY2026 Q2 | August 18, 2026 | $1.04B | +27% | FY26 GMV cut to $149B to $151B from greater than $155B, on roughly $600M of currency translation and a more measured view of German volumes; FY26 revenue $4.08B to $4.16B, partly reflecting a move to fair value accounting on new US and German Fair Financing originations; FY26 transaction margin dollars raised to $1.62B to $1.65B from greater than $1.61B; FY26 adjusted operating income $280M to $300M. Q3'26 GMV $35B to $36B, revenue $940M to $980M, TMD $340M to $360M, adjusted operating income $5M to $15M | s205.q4cdn.com |
YETIYETI · Public DTC brands | FY2026 Q2 | August 13, 2026 | $483.9M | +9% | FY26 sales growth maintained at 7% to 8%; adjusted operating margin raised to 14.9% from 14.6%; adjusted EPS raised to $2.94 to $3.00 (+19% to 21%) from $2.83 to $2.89; capex $60M to $70M and free cash flow $200M to $225M unchanged; outlook assumes US tariff rates return to roughly 20% in H2; Investor Day September 17 in Austin | investors.yeti.com |
Global-eGLBE · Commerce infrastructure | FY2026 Q2 | August 12, 2026 | $299M | +39% | Q3'26 GMV $1,995M to $2,045M, revenue $308.5M to $315.5M, adjusted EBITDA $58.5M to $62.5M. FY26 raised across every metric: GMV $8,810M to $9,110M from $8,530M to $8,880M, revenue $1,305M to $1,355M from $1,220M to $1,280M, adjusted EBITDA $278M to $300M from $264.5M to $289.5M. Passport expected to add $55M to $59M of H2 revenue and $3M to $4M of adjusted EBITDA | globenewswire.com |
On HoldingONON · Public DTC brands | FY2026 Q2 | August 11, 2026 | $952.34M | +13.5% | FY26 constant currency net sales growth in the low-20% range, implying CHF 3.47B to CHF 3.56B at current spot rates; FY26 gross profit margin raised to at least 65.0%; adjusted EBITDA margin reiterated at 19.5% to 20.0%; excludes any benefit from anticipated second-half tariff refunds | press.on-running.com |
CelsiusCELH · Public DTC brands | FY2026 Q2 | August 6, 2026 | $817.9M | +11% | None. The release contains no forward guidance or outlook section | ir.celsiusholdingsinc.com |
Commerce.comCMRC · Commerce infrastructure | FY2026 Q2 | August 6, 2026 | $84.5M | +0.1% | Q3'26 revenue $82.5M to $85.5M; Q3 non-GAAP operating income $3.3M to $5.3M. FY26 revenue $336.5M to $344.5M; FY26 non-GAAP operating income $28.0M to $34.0M | sec.gov |
FIGSFIGS · Public DTC brands | FY2026 Q2 | August 6, 2026 | $196.6M | +28.8% | FY26 net revenues growth of approximately 20% against 2025, raised; FY26 adjusted EBITDA margin 14.8% to 15.0% | sec.gov |
KenvueKVUE · CPG strategics | FY2026 Q2 | August 6, 2026 | $3.96B | +3% | None. Kenvue is not providing forward-looking guidance and held no earnings call because of the pending Kimberly-Clark transaction, which the release says is expected to close in the fourth quarter of 2026 | kenvue.com |
Once Upon a Farm, PBCOFRM · Public DTC brands | FY2026 Q2 | August 6, 2026 | $85.4M | +42.3% | FY2026 net sales $327M to $335M, growth of 36% to 39% versus 2025; adjusted EBITDA $3M to $4.5M. Both were raised, per the release headline; the prior ranges are not restated in the document, so the size of the raise is not derivable. Guidance as of 2026-08-06, the release's own stated basis date | sec.gov |
The Trade DeskTTD · Ad platforms | FY2026 Q2 | August 6, 2026 | $715.1M | +3% | Q3'26 revenue at least $650M, which is below the $715M just delivered, and adjusted EBITDA of approximately $160M, implying a margin near 25% against the 34% just printed | investors.thetradedesk.com |
Warby ParkerWRBY · Public DTC brands | FY2026 Q2 | August 6, 2026 | $235.5M | +9.8% | FY26 reaffirmed rather than raised: net revenue $959M to $976M, growth of approximately 10% to 12%; adjusted EBITDA $117M to $119M, a 12.2% margin and roughly 130bps of expansion, including a full-year $14.4M tariff-refund benefit; 50 new store openings; excludes any revenue or halo contribution from Intelligent Eyewear | sec.gov |
AppLovinAPP · Ad platforms | FY2026 Q2 | August 5, 2026 | $1.92B | +53% | Q3'26 revenue $2,055M to $2,085M, which is 7% to 8% sequential growth off the Q2 base; Q3 adjusted EBITDA $1,710M to $1,740M at an 83% margin | s21.q4cdn.com |
BlockXYZ · Payments and BNPL | FY2026 Q2 | August 5, 2026 | $6.62B | Q3'26 gross profit $3.13B, +18%; Q3 adjusted operating income $875M at a 28% margin; Q3 adjusted diluted EPS $1.02, +89%. FY26 gross profit $12.51B, +21%; FY26 adjusted operating income $3.47B at a 28% margin, growing 67%; FY26 adjusted diluted EPS $4.02, +70% | sec.gov | |
HubSpotHUBS · Commerce infrastructure | FY2026 Q2 | August 5, 2026 | $911.7M | +20% | Q3'26 revenue $924.0M to $925.0M, +14% as reported and +15% constant currency; Q3 non-GAAP operating income $187.0M to $188.0M at a 20% margin; Q3 non-GAAP EPS $3.25 to $3.27. FY26 revenue $3.678B to $3.686B, +18% as reported and +16% constant currency; FY26 non-GAAP operating income $762.0M to $766.0M at a 21% margin; FY26 non-GAAP EPS $13.23 to $13.31 | sec.gov |
KlaviyoKVYO · Commerce infrastructure | FY2026 Q2 | August 5, 2026 | $370.6M | +26% | Q3'26 revenue $377M to $381M, growth of 21.5% to 22.5%; Q3 non-GAAP operating income $40M to $43M at a 10.5% to 11% margin. FY26 raised to $1,526M to $1,534M, growth of 24%; FY26 non-GAAP operating income $212M to $218M at a 14% margin | sec.gov |
ShopifySHOP · Commerce infrastructure | FY2026 Q2 | August 5, 2026 | $3.58B | +34% | Q3'26 revenue growth low-thirties percent; gross profit dollars mid-to-high twenties percent; operating expenses 33% to 34% of revenue; stock-based compensation $150M; free cash flow margin high-teens to low-twenties | globenewswire.com |
e.l.f. BeautyELF · Public DTC brands | FY2027 Q1 | August 5, 2026 | $479.4M | +36% | FY27 outlook raised: net sales $1,938M to $1,968M from $1,835M to $1,865M, an expected 18% to 20% increase against 12% to 14% previously; adjusted EBITDA $401M to $407M from $379M to $385M; adjusted net income $212M to $215M; adjusted diluted EPS $3.50 to $3.55; adjusted tax rate 25% to 26% on 60.5M weighted average diluted shares. No quarterly guidance given | sec.gov |
PinterestPINS · Ad platforms | FY2026 Q2 | August 4, 2026 | $1.18B | +18% | Q3'26 revenue $1,190M to $1,210M, +13% to +15%, assuming a modest FX headwind; Q3 adjusted EBITDA $335M to $355M | sec.gov |
RevolveRVLV · Public DTC brands | FY2026 Q2 | August 4, 2026 | $347.4M | +12% | Q3'26 and FY26 gross margin 53.5% to 54.0%, assuming no further IEEPA refunds; Q3 marketing 15.8% to 16.0% of net sales and FY26 15.3% to 15.8%; Q3 selling and distribution 17.1% to 17.3% and fulfillment 3.2% to 3.4% | prnewswire.com |
Suja Life, Inc.SUJA · Public DTC brands | FY2026 Q2 | August 4, 2026 | $83.9M | +11.6% | FY2026 (year ending Dec 28) net sales $360M to $369M, growth of 10.2% to 13.0% against $326.6M in fiscal 2025; adjusted EBITDA $70M to $72M, growth of 72.8% to 77.7% against $40.5M, "consistent with prior expectations"; base tax rate 26.1%. Guidance as of 2026-08-04. The framing is "updating its outlook... reflecting near-term softness concentrated in the grocery channel", so the revision was sales-only and EBITDA was explicitly held; the prior sales range is not restated, so the size of the cut is not derivable. Superseded in part on 2026-08-20: see the guidance events tab | sec.gov |
ToastTOST · Payments and BNPL | FY2026 Q2 | August 4, 2026 | $1.91B | Q3'26 non-GAAP subscription and fintech gross profit $615M to $625M, growth of 22% to 24%; Q3 adjusted EBITDA $210M to $220M. FY26 non-GAAP subscription and fintech gross profit $2,325M to $2,355M, growth of 23% to 25%, raised from 21% to 23%; FY26 adjusted EBITDA $805M to $825M, raised from $790M to $810M | sec.gov | |
WixWIX · Commerce infrastructure | FY2026 Q2 | August 4, 2026 | $563.1M | +15% | FY26 maintained: revenue growth low to mid teens, bookings low teens, FCF margin high teens excluding acquisition and restructuring costs; Q3 revenue growth low double digits; Base44 non-GAAP gross margin guided to roughly 60% in H2 from near zero entering the year | globenewswire.com |
SnapSNAP · Ad platforms | FY2026 Q2 | August 3, 2026 | $1.6B | +19% | Q3 2026 outlook given on the earnings call and in the investor letter, not in the release | sec.gov |
Church & DwightCHD · CPG strategics | FY2026 Q2 | July 31, 2026 | $1.53B | +1.6% | FY26 RAISED across the board: net sales flat to +1% (from -1.5% to -0.5%), organic +4% to +5% (from +3% to +4%), adjusted gross margin expansion roughly 100 to 120bps, reported EPS +20% to +22%, adjusted EPS +6% to +8% (from +5% to +8%), operating cash flow about $1.175B (from $1.150B). Marketing at or above 11% of sales. Q3 guide: organic +3%, reported sales -1%, marketing about 12% of sales, adjusted EPS about $0.89 | sec.gov |
ColgateCL · CPG strategics | FY2026 Q2 | July 31, 2026 | $5.36B | +4.9% | FY26 net sales still +2% to +6% and organic still +1% to +4%. Gross margin guidance RAISED from down to roughly flat on both GAAP and Base Business. Base Business EPS growth raised to mid-single-digit from low-to-mid; GAAP still double-digit | investor.colgatepalmolive.com |
AmazonAMZN · Ad platforms | FY2026 Q2 | July 30, 2026 | $200.61B | +20% | Q3'26 net sales $197.0B to $202.0B, +9% to +12%, and nearly 400bps higher excluding the Prime Day timing shift in both years, with an FX headwind of roughly 80bps; Q3 operating income $22.5B to $26.5B vs $17.4B | businesswire.com |
RedditRDDT · Ad platforms | FY2026 Q2 | July 30, 2026 | $804.9M | +61% | Q3'26 revenue $860M to $870M; Q3 adjusted EBITDA $385M to $395M | sec.gov |
The Hershey CompanyHSY · CPG strategics | FY2026 Q2 | July 30, 2026 | $2.79B | +6.6% | FY26 narrowed UP: net sales +4.5% to 5% (from 4% to 5%), organic +3% to 3.5% (from 2.5% to 3.5%), reported EPS growth 82% to 89%, adjusted EPS growth 32.5% to 35%, adjusted EPS $8.36 to $8.52; tax rate 25% to 27%, interest expense $200M to $210M, capex $425M to $475M, roughly $100M of Advancing Agility & Automation savings; excludes potential future tariff rebates | prnewswire.com |
DanoneBN · CPG strategics | FY2026 H1 | July 29, 2026 | $15.05B | +3.5% | FY26 confirmed: LFL sales growth +3% to +5% with recurring operating income growing faster than sales | globenewswire.com |
MetaMETA · Ad platforms | FY2026 Q2 | July 29, 2026 | $60.8B | +28% | Q3'26 revenue $61B to $64B with FX about a 1-point headwind; FY26 total expenses raised at the low end to $165B to $169B to absorb the legal charges; FY26 capex narrowed to $130B to $145B (from $125B to $145B); tax rate 15% to 17% for the remaining quarters; still expects FY26 operating income above 2025 | investor.atmeta.com |
Procter & GamblePG · CPG strategics | FY2026 Q4 | July 29, 2026 | $21.2B | +2% | FY27 all-in and organic sales growth both +1% to +3% (including a 30 to 50 bps drag from brand and go-to-market discontinuations); FY27 diluted EPS +1% to +5%, core EPS in-line to +3% ($6.89 to $7.11); ~$1B after-tax commodity, energy and freight headwind plus $350M from interest, non-operating income and FX, a combined $0.56 per share or an 8-point drag on core EPS; capex 4.5% to 5.5% of sales; ~$10B dividends and ~$5B buyback | pginvestor.com |
Reynolds Consumer ProductsREYN · CPG strategics | FY2026 Q2 | July 29, 2026 | $944M | +0.6% | FY26 net revenues raised to +1% to +3% to account for increased pricing net of elasticity; FY26 net income and adjusted net income held at $331M to $343M, EPS and adjusted EPS $1.57 to $1.63, Adjusted EBITDA $660M to $675M; Q3 revenues approximately flat vs $931M, Q3 EPS $0.37 to $0.39, Q3 Adjusted EBITDA $160M to $165M; dividend held at $0.23 | investors.reynoldsconsumerproducts.com |
Coca-ColaKO · CPG strategics | FY2026 Q2 | July 28, 2026 | $13.4B | +7% | FY26 raised: organic ~5% (from 4-5%), comparable cc EPS ex-M&A 7-8%, comparable EPS 9-10%, FCF ~$12.4B | |
Mondelez InternationalMDLZ · CPG strategics | FY2026 Q2 | July 28, 2026 | $9.36B | +4.1% | FY26 organic raised to at least 2%; adjusted EPS growth held flat to +5% cc; FY FCF ~$3B | |
PayPalPYPL · Payments and BNPL | FY2026 Q2 | July 28, 2026 | $8.68B | +5% | FY26 non-GAAP EPS raised to ~$5.38 (from low-single-digit decline to slightly positive); FY26 GAAP EPS reaffirmed at a mid-single-digit decline; Q3'26 GAAP and non-GAAP EPS both a low-single-digit decline | sec.gov |
UnileverUL · CPG strategics | FY2026 H1 | July 28, 2026 | $27.65B | +0.5% | FY26 upgraded: USG within the 4% to 6% multi-year range with ~3% underlying volume growth (up from ~2%), H2 USG 4% to 5% led by pricing, modest underlying operating margin improvement vs 20.0% in 2025 | unilever.com |
NestleNSRGY · CPG strategics | FY2026 H1 | July 23, 2026 | $48.27B | +3.6% | FY26 reaffirmed: organic ~3% to 4% with accelerating RIG, UTOP margin to improve vs 2025 | nestle.com |
AlphabetGOOGL · Ad platforms | FY2026 Q2 | July 22, 2026 | $119.8B | +24% | FY26 capex guide raised to $195B to $205B (from ~$185B); Q2 capex $44.9B | sec.gov |
Conagra BrandsCAG · CPG strategics | FY2026 Q4 | July 15, 2026 | $2.88B | +3.6% | FY27 organic net sales -3% to -1% | conagrabrands.com |
PepsiCo (PEP)PEP · CPG strategics | FY2026 Q2 | July 9, 2026 | $24.18B | +6.4% | FY26 maintained organic +2% to +4%, core cc EPS +4% to +6% | investor.pepsico.com |
| Company | Quarter | Reported | Revenue | Growth | Guidance | Source |
|---|---|---|---|---|---|---|
ChewyCHWY · Public DTC brands | FY2026 Q1 | June 10, 2026 | $3.36B | +7.7% | FY26 revised DOWN $13.40B to $13.55B | sec.gov |
Oddity TechODD · Public DTC brands | FY2026 Q1 | June 2, 2026 | $197.9M | -26% | Q2'26 -25% to -30%; FY EBITDA positive | globenewswire.com |
BrazeBRZE · Commerce infrastructure | FY2027 Q1 | May 27, 2026 | $211M | +30% | FY27 raised $895M to $899M | sec.gov |
SalesforceCRM · Commerce infrastructure | FY2027 Q1 | May 27, 2026 | $11.1B | +13% | FY27 raised $45.9B to $46.2B | salesforce.com |
e.l.f. BeautyELF · Public DTC brands | FY2026 Q4 | May 20, 2026 | $449.3M | +35% | FY27 +12% to +14% | sec.gov |
KlarnaKLAR · Payments and BNPL | FY2026 Q1 | May 14, 2026 | $1B | +44% | Q2'26 GMV $35.5B to $36.5B | s205.q4cdn.com |
YETIYETI · Public DTC brands | FY2026 Q1 | May 14, 2026 | $380.4M | +8% | FY26 raised sales +7% to +8% | sec.gov |
Global-eGLBE · Commerce infrastructure | FY2026 Q1 | May 13, 2026 | $252.1M | +33% | FY26 raised | globenewswire.com |
WixWIX · Commerce infrastructure | FY2026 Q1 | May 13, 2026 | $541.2M | +14% | FY26 mid-teens % | globenewswire.com |
On HoldingONON · Public DTC brands | FY2026 Q1 | May 12, 2026 | $931.73M | +14.5% | FY26 GM raised to +>=64.5% | press.on-running.com |
AffirmAFRM · Payments and BNPL | FY2026 Q3 | May 7, 2026 | $1.04B | +33% | FY26 raised GMV $49.27B to $49.57B | sec.gov |
BlockXYZ · Payments and BNPL | FY2026 Q1 | May 7, 2026 | $2.91B | +27% | FY26 raised GP $12.33B (+19%) | stocktitan.net |
CelsiusCELH · Public DTC brands | FY2026 Q1 | May 7, 2026 | $782.6M | +138% | Margin expansion via "orbit" model | businesswire.com |
Commerce.comCMRC · Commerce infrastructure | FY2026 Q1 | May 7, 2026 | $86.8M | +5% | Q2'26 $84.5M to $85.5M | sec.gov |
FIGSFIGS · Public DTC brands | FY2026 Q1 | May 7, 2026 | $159.9M | +28% | FY26 raised +14% to +16% | ir.wearfigs.com |
HubSpotHUBS · Commerce infrastructure | FY2026 Q1 | May 7, 2026 | $881M | +23% | FY26 raised $3.700B to $3.708B | ir.hubspot.com |
KenvueKVUE · CPG strategics | FY2026 Q1 | May 7, 2026 | $3.91B | +4.5% | No guidance (pending K-C deal) | sec.gov |
The Trade DeskTTD · Ad platforms | FY2026 Q1 | May 7, 2026 | $689M | +12% | Q2'26 >=$750M | sec.gov |
ToastTOST · Payments and BNPL | FY2026 Q1 | May 7, 2026 | $1.63B | +22% | FY26 raised recurring GP $2.29B to $2.32B | sec.gov |
Warby ParkerWRBY · Public DTC brands | FY2026 Q1 | May 7, 2026 | $242.4M | +8.3% | FY26 reaffirmed $959M to $976M | sec.gov |
AppLovinAPP · Ad platforms | FY2026 Q1 | May 6, 2026 | $1.84B | +59% | Q2'26 $1.915B to $1.945B | investors.applovin.com |
SnapSNAP · Ad platforms | FY2026 Q1 | May 6, 2026 | $1.53B | +12% | Q2'26 $1.52B to $1.55B | sec.gov |
KlaviyoKVYO · Commerce infrastructure | FY2026 Q1 | May 5, 2026 | $358M | +28% | FY26 raised $1.514B to $1.522B | investors.klaviyo.com |
PayPalPYPL · Payments and BNPL | FY2026 Q1 | May 5, 2026 | $8.35B | +7% | Q2'26 EPS ~ -9% (toughest comp) | sec.gov |
RevolveRVLV · Public DTC brands | FY2026 Q1 | May 5, 2026 | $342.9M | +16% | FY26 GM 53.5% to 54.0% | sec.gov |
ShopifySHOP · Commerce infrastructure | FY2026 Q1 | May 5, 2026 | $3.17B | +34% | Q2'26 high-20s% rev | shopify.com |
PinterestPINS · Ad platforms | FY2026 Q1 | May 4, 2026 | $1.01B | +18% | Q2'26 $1.133B to $1.153B; ~$2B buyback | sec.gov |
Church & DwightCHD · CPG strategics | FY2026 Q1 | May 1, 2026 | $1.47B | +0.2% | FY26 organic +3% to +4% | sec.gov |
ColgateCL · CPG strategics | FY2026 Q1 | May 1, 2026 | $5.32B | +8.4% | FY26 net sales +2% to +6% | businesswire.com |
Estee LauderEL · CPG strategics | FY2026 Q3 | May 1, 2026 | $3.71B | +5% | FY26 raised again; first FY27 view +3% to +5% | sec.gov |
RedditRDDT · Ad platforms | FY2026 Q1 | April 30, 2026 | $663M | +69% | Q2'26 $715M to $725M | sec.gov |
UnileverUL · CPG strategics | FY2026 Q1 | April 30, 2026 | $13.61B | +3.8% | FY26 USG bottom of 4% to 6% | unilever.com |
AlphabetGOOGL · Ad platforms | FY2026 Q1 | April 29, 2026 | $109.9B | +22% | FY26 capex $175B to $185B | sec.gov |
AmazonAMZN · Ad platforms | FY2026 Q1 | April 29, 2026 | $181.5B | +17% | Q2'26 $194B to $199B (Prime Day) | sec.gov |
MetaMETA · Ad platforms | FY2026 Q1 | April 29, 2026 | $56.31B | +33% | Q2'26 $58B to $61B; FY capex raised to $125B to $145B | s21.q4cdn.com |
Coca-ColaKO · CPG strategics | FY2026 Q1 | April 28, 2026 | $12.5B | +12% | FY26 EPS raised to +8% to +9% | coca-colacompany.com |
Mondelez InternationalMDLZ · CPG strategics | FY2026 Q1 | April 28, 2026 | $10.08B | +8.2% | FY26 reaffirmed organic flat to +2% | sec.gov |
Procter & GamblePG · CPG strategics | FY2026 Q3 | April 24, 2026 | $21.2B | +7% | FY26 held, EPS toward low end | pginvestor.com |
NestleNSRGY · CPG strategics | FY2026 Q1 | April 23, 2026 | $23.86B | +3.5% | FY26 OG ~3% to 4% | nestle.com |
DanoneBN · CPG strategics | FY2026 Q1 | April 22, 2026 | $7.24B | +2.7% | FY26 confirmed LFL +3% to +5% | danone.com |
PepsiCo (PEP)PEP · CPG strategics | FY2026 Q1 | April 16, 2026 | $19.44B | +8.5% | FY26 affirmed organic +2% to +4% | sec.gov |
Conagra BrandsCAG · CPG strategics | FY2026 Q3 | April 1, 2026 | $2.79B | -1.9% | sec.gov |
| Company | Quarter | Reported | Revenue | Growth | Guidance | Source |
|---|---|---|---|---|---|---|
ChewyCHWY · Public DTC brands | FY2025 Q4 | March 25, 2026 | $3.26B | +0.5% | Initial FY26 guide (revised in June) | businesswire.com |
BrazeBRZE · Commerce infrastructure | FY2026 Q4 | March 24, 2026 | $205.2M | +28% | FY27 $884M to $889M | sec.gov |
WixWIX · Commerce infrastructure | FY2025 Q4 | March 4, 2026 | $524.3M | +14% | FY26 mid-teens % | sec.gov |
On HoldingONON · Public DTC brands | FY2025 Q4 | March 3, 2026 | $833.06M | +22.6% | FY26 net sales +>=23% cc | press.on-running.com |
BlockXYZ · Payments and BNPL | FY2025 Q4 | February 26, 2026 | $2.89B | +24% | FY26 gross profit $12.2B (+18%) | investors.block.xyz |
CelsiusCELH · Public DTC brands | FY2025 Q4 | February 26, 2026 | $721.6M | +117% | GM back to "low 50s" in 2026 | s203.q4cdn.com |
FIGSFIGS · Public DTC brands | FY2025 Q4 | February 26, 2026 | $201.9M | +33% | FY26 rev +10% to +12% | sec.gov |
Warby ParkerWRBY · Public DTC brands | FY2025 Q4 | February 26, 2026 | $212M | +11% | FY26 $959M to $976M | sec.gov |
Oddity TechODD · Public DTC brands | FY2025 Q4 | February 25, 2026 | $153M | +24% | Q1'26 ~ -30% YoY | sec.gov |
SalesforceCRM · Commerce infrastructure | FY2026 Q4 | February 25, 2026 | $11.2B | +12% | FY27 $45.8B to $46.2B | salesforce.com |
The Trade DeskTTD · Ad platforms | FY2025 Q4 | February 25, 2026 | $847M | +14% | Q1'26 >=$678M | businesswire.com |
RevolveRVLV · Public DTC brands | FY2025 Q4 | February 24, 2026 | $324.4M | +10% | FY26 marketing 15.3% to 15.8% of sales | prnewswire.com |
DanoneBN · CPG strategics | FY2025 FY | February 20, 2026 | $29.47B | +4.5% | FY26 LFL +3% to +5% | danone.com |
KlarnaKLAR · Payments and BNPL | FY2025 Q4 | February 19, 2026 | $1.08B | +38% | Thesis: shift to pay-over-time | s205.q4cdn.com |
NestleNSRGY · CPG strategics | FY2025 FY | February 19, 2026 | $100.24B | +3.5% | FY26 OG ~3% to 4% | nestle.com |
YETIYETI · Public DTC brands | FY2025 Q4 | February 19, 2026 | $583.7M | +7% | FY26 sales +6% to +8% | sec.gov |
Global-eGLBE · Commerce infrastructure | FY2025 Q4 | February 18, 2026 | $336.7M | +28% | Q1'26 rev $247M to $254M | globenewswire.com |
KenvueKVUE · CPG strategics | FY2025 Q4 | February 17, 2026 | $3.78B | +3.2% | No guidance (pending K-C deal) | sec.gov |
Commerce.comCMRC · Commerce infrastructure | FY2025 Q4 | February 12, 2026 | $89.5M | +3% | Q1'26 $82.5M to $83.5M | sec.gov |
PinterestPINS · Ad platforms | FY2025 Q4 | February 12, 2026 | $1.32B | +14% | Q1'26 $951M to $971M | businesswire.com |
ToastTOST · Payments and BNPL | FY2025 Q4 | February 12, 2026 | $1.63B | +22% | Q1'26 recurring GP $505M to $515M | sec.gov |
UnileverUL · CPG strategics | FY2025 FY | February 12, 2026 | $54.54B | +3.5% | FY26 USG bottom of 4% to 6% | unilever.com |
AppLovinAPP · Ad platforms | FY2025 Q4 | February 11, 2026 | $1.66B | +66% | Q1'26 $1.745B to $1.775B | investors.applovin.com |
HubSpotHUBS · Commerce infrastructure | FY2025 Q4 | February 11, 2026 | $846.7M | +20% | FY26 $3.69B to $3.70B | ir.hubspot.com |
ShopifySHOP · Commerce infrastructure | FY2025 Q4 | February 11, 2026 | $3.67B | +31% | Q1'26 low-30s% rev | shopify.com |
Coca-ColaKO · CPG strategics | FY2025 Q4 | February 10, 2026 | $11.8B | +2% | FY26 organic +4% to +5% | coca-colacompany.com |
KlaviyoKVYO · Commerce infrastructure | FY2025 Q4 | February 10, 2026 | $350.2M | +30% | FY26 $1.501B to $1.509B | investors.klaviyo.com |
AffirmAFRM · Payments and BNPL | FY2026 Q2 | February 5, 2026 | $1.12B | +30% | FQ3'26 GMV $11.0B to $11.25B | sec.gov |
AmazonAMZN · Ad platforms | FY2025 Q4 | February 5, 2026 | $213.4B | +14% | Q1'26 $173.5B to $178.5B; ~$200B capex | sec.gov |
Estee LauderEL · CPG strategics | FY2026 Q2 | February 5, 2026 | $4.23B | +6% | FY26 raised organic +1% to +3% | media.elcompanies.com |
RedditRDDT · Ad platforms | FY2025 Q4 | February 5, 2026 | $726M | +70% | Q1'26 $595M to $605M; $1B buyback | sec.gov |
The Hershey CompanyHSY · CPG strategics | FY2025 Q4 | February 5, 2026 | $3.09B | +7% | sec.gov | |
AlphabetGOOGL · Ad platforms | FY2025 Q4 | February 4, 2026 | $113.8B | +18% | FY26 capex $175B to $185B | sec.gov |
Reynolds Consumer ProductsREYN · CPG strategics | FY2025 Q4 | February 4, 2026 | $1.03B | +1.2% | sec.gov | |
SnapSNAP · Ad platforms | FY2025 Q4 | February 4, 2026 | $1.72B | +10% | Q1'26 $1.50B to $1.53B; $500M buyback | sec.gov |
e.l.f. BeautyELF · Public DTC brands | FY2026 Q3 | February 4, 2026 | $489.5M | +38% | FY26 raised +22% to +23% | sec.gov |
Mondelez InternationalMDLZ · CPG strategics | FY2025 Q4 | February 3, 2026 | $10.5B | +9.3% | FY26 organic flat to +2% | sec.gov |
PayPalPYPL · Payments and BNPL | FY2025 Q4 | February 3, 2026 | $8.68B | +4% | FY26 EPS flat to slightly positive | sec.gov |
PepsiCo (PEP)PEP · CPG strategics | FY2025 Q4 | February 3, 2026 | $29.34B | +5.6% | FY26 organic +2% to +4% | sec.gov |
Church & DwightCHD · CPG strategics | FY2025 Q4 | January 30, 2026 | $1.64B | +3.9% | FY26 organic +3% to +4% | investor.churchdwight.com |
ColgateCL · CPG strategics | FY2025 Q4 | January 30, 2026 | $5.23B | +5.8% | FY26 net sales +2% to +6% | sec.gov |
MetaMETA · Ad platforms | FY2025 Q4 | January 28, 2026 | $59.89B | +24% | Q1'26 $53.5B to $56.5B; FY capex $115B to $135B | sec.gov |
Procter & GamblePG · CPG strategics | FY2026 Q2 | January 22, 2026 | $22.2B | +1% | FY26 organic in-line to +4% | sec.gov |
Who is on
the roster.
| Layer | Reports logged | Companies |
|---|---|---|
CPG strategics | 356 | 14 |
Public DTC brands | 207 | 12 |
Ad platforms | 194 | 8 |
Commerce infrastructure | 187 | 8 |
Payments and BNPL | 101 | 5 |
Earlier years,
on their own pages.
Each year from 2020 has its own page with every report published that year, by quarter.
What the ad platforms
said about pricing.
The 15 ad-market figures the platforms disclosed in these reports, as a change on the prior year.
| Company | Fiscal year | Fiscal quarter | Metric | Change |
|---|---|---|---|---|
Amazon | 2026 | Q2 | Ad revenue, year over year | 26% |
Meta | 2025 | Q4 | Ad impressions, year over year | 18% |
Meta | 2025 | Q4 | Price per ad, year over year | 6% |
Meta | 2026 | Q1 | Ad impressions, year over year | 19% |
Meta | 2026 | Q1 | Price per ad, year over year | 12% |
Meta | 2026 | Q2 | Ad revenue, year over year | 27% |
Meta | 2026 | Q2 | Ad impressions, year over year | 14% |
Meta | 2026 | Q2 | Price per ad, year over year | 12% |
Reddit | 2025 | Q4 | Ad revenue, year over year | 75% |
Reddit | 2026 | Q1 | Ad revenue, year over year | 74% |
Reddit | 2026 | Q2 | Ad revenue, year over year | 64% |
Snap | 2025 | Q4 | eCPM, year over year | -8% |
Snap | 2025 | Q4 | Ad impressions, year over year | 14% |
Snap | 2026 | Q1 | eCPM, year over year | -12% |
Snap | 2026 | Q1 | Ad impressions, year over year | 17% |
Questions I get about
reading these earnings.
Which public companies most affect DTC and consumer brands?
Five layers set the weather. Ad platforms (Meta, Google, Amazon, plus Reddit, Pinterest, Snap, The Trade Desk, AppLovin) set your CPMs. Commerce infrastructure (Shopify, Klaviyo, Global-e, Braze, HubSpot) sets which features get roadmap priority. Payments and BNPL (Affirm, PayPal, Block, Klarna, Toast) are a real-time read on discretionary spend. Public DTC brands (e.l.f., Oddity, Warby Parker, On, Celsius, YETI, FIGS, Chewy) are your closest comps. CPG strategics (P&G, Coca-Cola, PepsiCo, Unilever, Nestlé, Estée Lauder) are the acquirers and a read on category demand.
Are ad CPMs going up in 2026?
On the big platforms, yes, and in Q2 2026 the challengers joined them. Meta's average price per ad rose 12% year over year while impression growth slowed to 14% from 19%, Amazon's advertising revenue accelerated to plus 26%, and Google Search ad revenue held plus 17%. The cheaper channels repriced too: Snap's North American ARPU jumped 23% on a North American audience that shrank 7%, Pinterest's US and Canada ARPU rose 14% on only 4% more users, and Reddit's US ARPU rose 51% on 6% more US users. Pinterest is still the cheapest scaled inventory in absolute terms at $1.86 global ARPU, but budget Q4 on higher CPMs everywhere rather than assuming a cheap channel is waiting.
What do 2026 earnings say about consumer spending?
Spending is resilient but value-conscious. The BNPL names all grew volume in the low-to-mid 30s percent with benign credit (Affirm delinquencies stable near 2.7 to 2.8%, Klarna loss provisions falling to 0.55% of GMV), and both managements described the consumer as financially healthy. But PayPal's branded checkout grew only 1 to 2%, and in CPG the food and beverage giants grew almost entirely on price while volumes were flat to negative, a sign consumers are stretched in center-store categories. The healthiest demand showed up in beauty, personal care, and health-positioned food.
What is Shopify prioritizing in 2026?
AI-native and agentic commerce. Across its Q4 2025 and Q1 2026 reports Shopify said it is funding Catalog, Sidekick, and a Google-co-developed Universal Commerce Protocol so AI agents transact through its checkout rather than around it, while posting its first quarters above $100B in GMV. B2B GMV grew 96% and Shop Pay GMV grew 62% for the year. For a Shopify brand or app founder, the read is that AI discovery, agentic checkout, B2B, and Markets are where roadmap budget is going, so adopting them early aligns you with the platform.
How is this earnings tracker sourced and kept current?
Every row ties to a primary source: the company's investor-relations press release or its SEC filing (8-K, 10-Q, 6-K, F-1). It covers every reporting wave since 2020. The 2026 waves so far are the Q4 2025 and full-year reports released from late January through March, the Q1 2026 reports released from April through June, and the Q2 2026 reports landing from July into August. It is refreshed daily as new prints and S-1 filings land, and figures are labeled where a number was reported rather than officially disclosed.
Want the operator read on your own numbers?
I read these earnings the way I ran WIN's operating cadence: to plan media budgets, time feature adoption, and see where category demand and acquirer appetite are heading. If you want that applied to your brand, your channel mix, or your exit timing, that is the work I do with operators. The form takes two minutes.
Start a conversation How I work with Shopify apps →