A Shopify store loading one or two seconds slower than it should can quietly cost over $200,000 a year in lost conversion. Speed is not a technical problem for a future sprint. It is a revenue problem, and fixing it needs understanding, not more budget.
- The penalty shows up in conversion every day and never appears in a marketing report.
- Unlike acquisition spend, fixing speed does not require more budget, just knowing where the money goes.
- Speed and your app stack are inseparable; every app you add adds load time.
Your Shopify store is probably losing over $200,000 a year to a problem that doesn't show up in any marketing report. No campaign failure. No product issue. No team mistake. Just a page that loads one or two seconds slower than it should, and a conversion rate that quietly pays the penalty every single day.
Most merchants treat speed as a technical problem. Something for a developer to fix eventually, in a future sprint, after the more urgent things get handled. That framing is wrong. Speed is a revenue problem. And unlike acquisition spend, fixing it doesn't require more budget, it just requires understanding where the money is going. It's also inseparable from your app stack decisions, every app you add is adding load time, which means the app audit and the speed audit should be run together.
The math your
speed score
doesn't show you.
A 1-second delay in page load time reduces conversion rates by approximately 7%. That stat has been validated across millions of sessions and is consistent enough to build a business case around. So let's build one.
Take a Shopify store doing $3M in annual revenue. If that store loads in 3.5 seconds and can be reduced to 2.5 seconds (one second), the math looks like this: 7% of $3M is $210,000 in recoverable annual revenue, and none of it comes from a campaign, a price increase, or a new product launch. It comes from pages that load faster.
That $210,000 requires zero additional ad spend. The traffic is already there. The acquisition cost has already been paid. You're just converting more of what you paid to bring in. To run this same math on your own store, use the free conversion rate revenue-leak calculator: sessions, times the gap, times AOV.
The reason merchants don't think about it this way is that slow load times don't generate a Shopify notification. There's no alert that says "you lost $17,500 this month because your homepage took 4 seconds to load." The revenue just quietly doesn't arrive. Shoppers bounce. They don't come back. You spend more on acquisition to compensate, which compounds the problem rather than solving it. This shows up directly in your cohort LTV data as lower-than-expected second purchase rates from paid channels.
Where the 7%
actually comes from.
The figure is directional, not a guarantee, no single study will replicate exactly on your store. But the direction and magnitude are consistent across independent research covering hundreds of millions of sessions.
The most cited source is a Google-commissioned study by Deloitte and 55, examining 37 leading brand sites across Europe and North America with data from over 30 million user sessions. It found that a 0.1-second improvement in mobile load time increased conversions by 8.4% in retail and boosted average order value by 9.2%. Not 0.1 seconds less than your target. Just 100 milliseconds.
Shopify's own published data on store speed and conversion shows a consistent relationship: faster stores convert at higher rates across every store size and category. The correlation is strongest on mobile, where Shopify data shows speed has approximately 70% more impact on conversion than the same speed improvement would have on desktop. The reason is simple. Mobile users are browsing on slower connections, with lower patience thresholds, and often with a thumb rather than a cursor, every extra second of waiting costs more patience than it would on desktop.
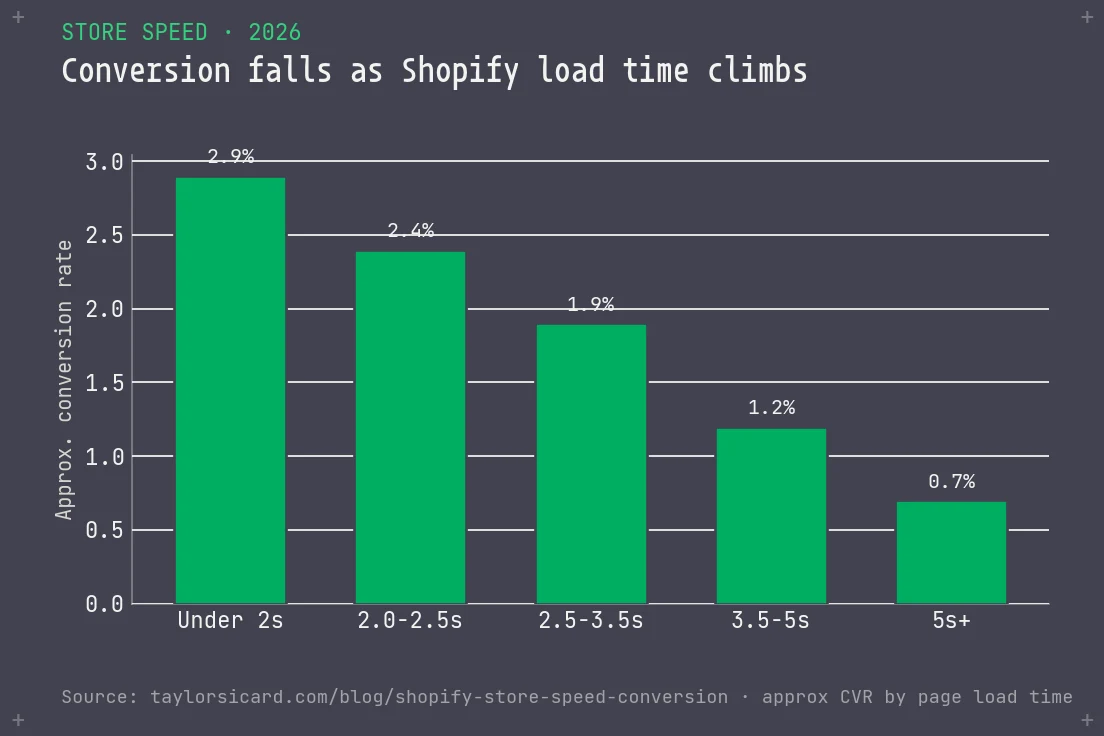
The conversion rate by load time data is directional but useful as a benchmark:
| Load Time | Approx. CVR | Relative Performance | Fix Priority |
|---|---|---|---|
Under 2 seconds |
~2.9% |
Best tier | Maintain |
2.0 – 2.5 seconds |
~2.4% |
Above average | Solid baseline |
2.5 – 3.5 seconds |
~1.9% |
Average | Optimize |
3.5 – 5 seconds |
~1.2% |
Below average | Fix now |
5+ seconds |
0.6 – 0.8% |
Critical | Emergency |
Vodafone documented a 31% LCP improvement that resulted in an 8% increase in sales. Rakuten 24 found that achieving good LCP scores led to a 53% increase in revenue per visitor and a 33% increase in conversion rate, an extreme outlier, but directionally consistent with the research. These aren't small companies with unusual traffic patterns. The pattern holds at scale.
One number in particular deserves attention. As mobile page load time increases from 1 second to 5 seconds, bounce probability increases by 90%. Those are visitors who never even see your product. No product photography, no reviews, no offer, just a loading screen they didn't wait for.
Working through this at a brand past $5M? It's the work I do with DTC operators at that stage, and the form takes two minutes.
What to measure
before you start
fixing anything.
Before touching a single app or image, you need a baseline. Most merchants haven't looked at their actual load time with any rigor, they rely on gut feel ("seems fast enough") or a Shopify speed score that doesn't tell the complete story. Here are the four measurement tools that matter, in order of how to use them.
Shopify's Built-In Speed Score
Find it in your Shopify admin under Online Store > Themes. Scores run 1–100. Below 50 is a problem. Above 70 is solid. The score also compares you to similar stores, which gives useful competitive context. What it leaves out is specific Core Web Vital scores, the numbers that actually correlate with conversion and SEO rankings.
Google PageSpeed Insights
Go to pagespeed.web.dev and enter your URL. This gives you the Core Web Vitals breakdown: LCP (Largest Contentful Paint), FID (First Input Delay), and CLS (Cumulative Layout Shift). LCP under 2.5 seconds is the target for the "Good" threshold, this is what Google uses for search ranking signals and what the conversion research is built around. Run it on mobile, not just desktop. Mobile scores are almost always worse, and mobile is where the majority of your traffic is.
GTmetrix
More technically detailed than PageSpeed Insights. GTmetrix shows a waterfall breakdown of every resource loading on your page (scripts, stylesheets, fonts, images) with timing data for each. This is where you find the specific culprits, whether it's an app script adding 800 milliseconds or an image sitting at 2.4MB when it should be 200KB. Start here when you're ready to move from measurement to fixing.
Real User Monitoring
Synthetic tests (PageSpeed Insights, GTmetrix) run from controlled environments. Real User Monitoring shows you actual load times from real visitors on real devices and connections. Triple Whale, Google Analytics 4, and several Shopify-native analytics apps surface this data by device type. It's the most accurate picture of what your customers are actually experiencing, and it often shows mobile performance materially worse than synthetic tests suggest.
Run all four. Build a baseline doc with your current Shopify speed score, your LCP on mobile from PageSpeed Insights, and the top three script/resource offenders from GTmetrix. That's your starting point.
The four things
slowing most
Shopify stores.
After working with dozens of Shopify merchants across a wide revenue range, the same culprits appear in almost every slow store. Not exotic edge cases. The same four things, in roughly the same order of frequency and impact.
| Speed Killer | Typical Impact | Frequency | Fix Priority |
|---|---|---|---|
|
Unoptimized Images
PNG/JPEG at original upload size, 1–5MB product photos, 4000px width images displaying at 1200px
|
+1.5–3.5s LCP | Nearly universal, 90%+ of slow stores |
Do first |
|
App Scripts on Every Page
20+ apps each loading JavaScript globally, including unused or page-specific tools loading everywhere
|
+0.8–2.5s load | Common, most stores with 15+ apps |
Do first |
|
Third-Party Scripts
Live chat widgets, exit-intent pop-ups, ad pixels, loyalty program scripts, each adding HTTP requests
|
+0.3–1.2s load | Very common, compounds with app scripts |
Audit and trim |
|
Heavy Theme / Liquid Render Time
Complex section-heavy themes, deep metafield lookups, excessive Liquid logic on high-traffic pages
|
+0.4–1.5s TTFB | Common in older themes and heavily customized stores |
Developer work |
The image problem alone accounts for 40–60% of total page weight on most Shopify stores. A product photo uploaded at 4,000 pixels wide and 3MB is being served to a mobile browser that displays it at 375px. The browser downloads three megabytes to show the visitor a product image roughly the size of their thumb. Every product page, every collection page, on every visit.
The app script problem is structural. Each Shopify app that injects JavaScript executes on every page your visitor loads, regardless of whether that app does anything on that page. A loyalty program widget that only renders on the account page still loads its script on the homepage, the product page, and checkout. A review app loads everywhere. A bundle builder loads everywhere. Twenty apps with page-level scripts adds between 800 milliseconds and 2.5 seconds to load time before a single product image renders.
"I've seen stores with 30 installed Shopify apps where 8 of them were still loading scripts on every page for tools the merchant hadn't actively used in six months. That's free money sitting in plain sight."
Third-party scripts compound the app script problem. A live chat widget, an exit-intent pop-up service, three ad tracking pixels, an affiliate attribution script, each one adds HTTP requests and load time. The question with each script is whether its value exceeds its speed cost. Some clearly do. Some clearly don't. Most merchants haven't done that math.
Five fixes, ranked by
how fast they
pay back.
Not every speed fix has the same ROI. The goal is to get the most conversion improvement from the least development investment. Here are the five highest-impact fixes in order of effort-to-impact ratio.
For compression before uploading: Squoosh (free, browser-based) and TinyPNG are the most practical tools. For batch processing existing Shopify images, TinyIMG is the most capable Shopify app for the job, free plan covers 50 optimizations, paid plans handle bulk library processing. Images can make up 60–80% of total page weight. This fix alone can cut LCP by 1–2 seconds on image-heavy stores.
Uninstall any app you haven't actively used in the past 90 days, even if it's free. Installed but inactive apps still load scripts. For apps you keep, check whether they support page-specific loading. A review widget only needs to load on product pages. A cart upsell app only needs to load on cart and product pages. Configuration options for this vary by app, but many support it if you look.
Each app adds an average of 200–500 milliseconds of load time. Cutting 5 apps typically recovers 1–2.5 seconds. For the full framework on pricing each app against both its fee and its speed cost, see the guide to the cost of app bloat.
Shopify themes built after 2021 typically have lazy loading enabled by default. If your store is on an older theme, check your theme settings or the theme code for
loading="lazy" attributes on image tags. This is a 30-minute check that can improve initial load time by 0.5–1 second on image-heavy pages.
This requires theme development work. Best addressed during a theme refresh rather than as a standalone project. If you're already doing development work, ask your developer to run a render-blocking audit as part of the scope.
This primarily matters at $10M+ revenue with active multi-market operations. If you're seeing high bounce rates or low conversion in specific geographies when overall performance looks healthy, CDN proximity is worth investigating. Check your GTmetrix results against the "server location" variable.
A common response to poor speed scores is to switch to a "faster" theme. The instinct is understandable. New theme, clean slate, better score. The risk is that merchants who switch themes without auditing the new theme's app script behavior, image handling, and Liquid complexity often end up with similar or worse scores within six months, after absorbing the migration cost and disruption.
Speed is not a theme property. It's a combination of theme code, app scripts, image library, and third-party integrations. A new theme fixes the theme component. If your app stack or image library is the primary culprit, a theme swap doesn't fix it. Do the measurement work first. You might discover the theme isn't the problem, and save yourself a migration project.
Making the business
case before you
spend a dollar.
Speed optimization work costs money. Development time, app subscriptions, an image processing tool. Before committing to any of it, build the business case. This takes 20 minutes and tells you whether the investment is worth prioritizing over other CRO projects.
- Current monthly revenue: Pull from Shopify Analytics for the trailing 3 months.
- Current conversion rate: Pull from Shopify Analytics, use "All sessions" view, not a filtered segment.
- Current page load time: Run Google PageSpeed Insights on your homepage and your top product page. Take the mobile LCP figure. Average the two.
- Calculate the gap: If your LCP is above 2.5 seconds, you have a fixable gap. For each full second above 2.5s, apply a 7% recovery estimate to monthly revenue.
- Compare against fix cost: Image optimization + app audit = 6–10 hours of internal time, roughly $0–$500. Developer-level fixes = $2,000–$8,000 depending on scope. Calculate payback period in months.
That plays out differently depending on store size.
Store A, $500K/month, 2.8% conversion rate, 3.5-second mobile LCP: The gap to 2.5 seconds is 1 second. At 7% per second, that's a 7% potential conversion lift. 7% of $500K is $35,000 in potential monthly recoverable revenue. Against a $5,000–$15,000 development investment, the payback period is under a month. Even if the actual improvement lands at half the theoretical estimate, it pays back in 2 months.
Store B, $150K/month, 1.8% conversion rate, 5.0-second mobile LCP: The gap to 2.5 seconds is 2.5 seconds. At 7% per second, that's a 17.5% potential conversion lift, but apply a conservative 40% discount for the theoretical vs. actual gap: 10.5% realistic estimate. 10.5% of $150K is $15,750/month. The image optimization and app audit work costs 6–10 hours of internal time. Payback: immediate.
The key discipline is to do the measurement first, build the business case, then prioritize fixes in order of effort-to-impact ratio. Don't start with developer-level work when the image library hasn't been touched. Don't hire a speed optimization agency when the app audit hasn't been run. The highest-ROI work is almost always the simplest to execute, and it should come first.
Speed is one of the few CRO levers that improves conversion rates, bounce rates, and SEO rankings simultaneously. Better LCP scores correlate with higher organic rankings. Lower bounce rates improve your site quality signals. Higher conversion rates improve the economics of every acquisition channel you're running. The same fix pays back across three dimensions at once. It also compresses your path to the next revenue inflection point by lifting the efficiency of every paid channel before you spend more on acquisition.
Most merchants reading this have a store loading over 3 seconds on mobile. If that's you, run PageSpeed Insights on your top product page right now. The number you see is a revenue figure waiting to be recovered. Render speed is also the first of nine product page elements worth shipping without a test, because everything else on the page is measured through it.
The questions
merchants ask
most.
Shopify's built-in speed score (in Online Store → Themes) runs 1–100. Above 70 is solid; below 50 is a problem worth prioritizing. More useful is your Google PageSpeed Insights mobile LCP score: under 2.5 seconds is the "Good" threshold Google uses for search ranking signals. That is the number to optimize toward, not the Shopify speed score. A store can have a Shopify score of 60 but a 4-second mobile LCP, which is the bigger revenue problem.
There is no hard number, but 15 or more apps that each load JavaScript on every page is a load time problem in practice. The question is not the count but the script behavior: does each app load globally or only on the pages where it operates? A store with 25 apps, all configured to load only on relevant pages, can outperform a store with 10 apps that all load everywhere. Review your app list and ask this question for each: would removing it hurt revenue, or is it infrastructure you forgot was there? Related: the full app stack framework by revenue tier covers which categories to keep and which to cut.
Sometimes, but usually not on its own. Speed is a function of theme code, app scripts, image library, and third-party integrations, all four. A new theme fixes the theme component. If your main culprit is a bloated image library and 25 globally-loading app scripts, a theme change will not solve it. Do the measurement work first: run GTmetrix and identify the three largest contributors to your load time. If the theme Liquid render time is the top item, a theme upgrade may help. If images and app scripts dominate, fix those before touching the theme.
Yes, directly. Core Web Vitals (LCP, FID, CLS) are a confirmed Google ranking signal since the Page Experience update. Stores with Good LCP scores receive a measurable lift in organic rankings compared to stores with Needs Improvement or Poor scores. The effect is strongest in competitive categories where multiple stores have similar content quality, and where page experience signals become a tiebreaker. Faster stores also generate lower bounce rates, which are a secondary quality signal. Speed work and SEO work share most of the same fixes.
LCP stands for Largest Contentful Paint: the time from page navigation until the largest visible element (usually the hero image or main product photo) finishes rendering. Google's threshold is: under 2.5 seconds = Good, 2.5–4.0 seconds = Needs Improvement, above 4.0 seconds = Poor. On Shopify stores, the LCP element is almost always a product image or hero banner, which is why unoptimized images have such an outsized impact on both your score and your conversion rate. A 1-second LCP improvement is typically the most direct conversion lever you have.
Store speed taxes every conversion metric you track, usually without anyone noticing. If yours is leaking revenue, the DTC growth consultant is built to find it. The form takes two minutes: start the conversation.
Scaling a consumer brand?
I take on one or two new clients a quarter and do the work myself, drawing on brands I've run from $5M past $100M. If you're in that range, the form takes two minutes.
Start a conversation More about Taylor →Free tools: Want to run your own numbers? Try the conversion revenue leak calculator.