The average DTC brand gets a second order from roughly one in five customers. A February 2026 study of 156,110 customers put the aggregate repeat purchase rate at 18.8%; broader industry aggregators put it at 25% to 30%. The aggregate barely matters, because repeat rate is set by what you sell before it is set by how well you sell it.
- Consumables (supplements, food, pet) run 30% to 45%. Beauty runs 25% to 40%. Apparel 20% to 32%. Home and durables sit under 18%.
- Half of all second orders happen within 30 days, three-quarters within 90 days. Most post-purchase flows go silent right through that window.
- 77% of second purchases are reorders of the same product, not cross-sells, so "ready for another?" beats "you might also like" in most categories.
About one in five first-time DTC customers ever comes back for a second order. A February 2026 analysis of 156,110 DTC customers put the aggregate repeat purchase rate at 18.8%, which means roughly 81% buy once and are never seen again (BS & Co, Repeat Purchase Rate Benchmarks, 2026). Broader industry aggregators put the number higher, closer to 25% to 30% over a twelve-month window. Both are correct. What those numbers mean for your brand depends on your category, and the timing data underneath tells you what to do about it.
The average misleads almost everyone because repeat purchase rate is set far more by what you sell than by how well you sell it. Somebody who buys a supplement will run out and reorder. The person who buys a rug never will. The product either creates the repeat occasion or it does not, and no email flow overcomes that. Your category's benchmark is the only one worth reading, which is why this page is built around it. For the wider view of which of these categories actually have the economics to work, pair this with the unit economics by category teardown.
One definition first, because the words get used loosely. Repeat purchase rate is the share of customers who placed two or more orders in a period, usually 365 days. Retention rate is a cohort measure: of the customers you acquired in a given window, what share is still buying later. Second-order rate is the share of first-time buyers who ever come back for a second order. They are related and move together, and I use them here as the set of retention benchmarks a DTC operator needs. The one that predicts your future earliest is the second-order rate, and I come back to why in section three.
18.8% or 30%?
Why the benchmarks
disagree.
If you search for the DTC repeat purchase rate you get two answers that look contradictory. The BS & Co study of 156,110 customers reports 18.8% on a strict 365-day window. Aggregators like Mobiloud and others put the DTC average at 25% to 30%. The two figures measure different things, and knowing how they differ keeps either one from misleading you.
Three things move the number. First, the window: a 365-day lookback counts fewer repeat buyers than a lifetime measure, because a customer who buys again in month 14 does not count in year one. Second, the sample: a single agency's client roster skews differently than a blended figure pulled across dozens of published studies, and a portfolio heavy on subscription-native brands reports far higher repeat rates than one full of one-time gift purchases. Third, what counts as "a customer": some studies include everyone who ever ordered, others only customers acquired inside the measurement window. Read the methodology before you trust the number.
For an operator, the practical move is to stop chasing the "real" DTC average and measure your own the same way every quarter. Pick a window, 365 days is the standard, and hold it constant. A benchmark is only useful as a comparison against a stable definition, and the most common self-inflicted mistake I see is a brand comparing its lifetime repeat rate to a published 365-day figure and concluding it is winning when it is not.
Repeat purchase
rate by category,
2026.
To answer "is my repeat rate good?", find your category, read the range, and treat the typical figure as your benchmark. The single biggest driver is replenishment: consumable products that get used up on a schedule generate the highest repeat rates, and considered, durable, high-ticket purchases generate the lowest. Everything else, the email program, the loyalty scheme, the post-purchase flow, moves you within your category's band, not out of it.
| Category | Repeat rate (12-mo) | Typical | Why |
|---|---|---|---|
Supplements & vitamins | 30–45% | ~38% | Daily use, runs out, reorders |
Coffee, food & beverage | 30–50% | ~35% | Consumed on a schedule |
Pet | 35–45% | ~40% | Replenishment, sticky routine |
Beauty & skincare | 25–40% | ~30% | Splits on a hero product |
Health & wellness | 25–38% | ~30% | Routine use, moderate frequency |
Apparel & fashion | 20–32% | ~25% | Seasonal, gifting, new styles |
Home & home decor | 8–18% | ~12% | Slow, considered, one-off |
Jewelry & luxury | 9–15% | ~11% | High AOV, low frequency |
Electronics & durables | 10–18% | ~14% | Long replacement cycle |
The spread is enormous, and it is almost entirely product-driven. Consumables cluster at the top: published ranges put supplements, food, and pet at 35% to 45%, and the top consumable brands in the BS & Co portfolio hit 39% to 44%. Fashion sits in the middle at roughly 20% to 32%. Durables and high-ticket categories sit at the bottom: home decor lands at 8% to 18% and jewelry around 9% to 11%, because nobody buys a second rug or a second engagement ring on a replenishment schedule. A quick gut check: if you sell consumables and sit below 25%, you have a retention problem worth investigating. If you sell durables and clear 15%, you are outperforming the norm.
Beauty deserves its own note, because it splits harder than any other category. A skincare brand with a genuine daily-use hero product behaves like a consumable, with repeat rates in the 30% to 40% range. A color-cosmetics brand chasing trends and one-time novelty buyers carries the same category label but behaves like the weak end of fashion. That split is the whole reason beauty commands the premiums it does when one of these businesses is sold, which I get into in the beauty acquisition multiples breakdown.
One reconciliation, because I want the numbers on this site to agree. TSC's one-card DTC benchmark reference lists slightly higher category ranges (supplements 40% to 60%, food and beverage 40% to 60%). Those reflect brands with an engineered subscription motion, where replenishment is deliberate rather than left to chance. The ranges in the table above are the broader cross-brand published numbers, which include the many brands that never build a real repeat engine. The gap between the two sets of ranges is the value a good operator adds.
"Repeat purchase rate is set by what you sell first, and how well you sell it second. Read your category's band, not the DTC average. The average is an accident of who got surveyed."
Plug in your repeat rate, order value, and margin to see the lifetime value it actually produces, and how much you can pay to acquire a customer. Free, no signup to see the result.
Second-order rate:
the earliest read
on retention.
If you only track one retention number, track the second-order rate: the share of first-time buyers who ever place a second order. It is the earliest reliable signal you have, because you can measure it on a fresh cohort within about 90 days rather than waiting a full year for a lifetime-value figure to mature. Retention takes months to show its full shape, and the second-order rate is the first part of it you can actually read.
It matters because the jump from one order to two is the hardest step in the whole customer lifecycle, and the most predictive. A customer who buys twice is dramatically more likely to buy a third, fourth, and fifth time; the decay curve flattens hard after order two. So the second-order rate is a leading indicator of lifetime value: move it up and you move the entire LTV curve up behind it, months before the LTV number itself is real. Brands that obsess over a twelve-month LTV they cannot see for a year are flying on a lagging instrument when the second-order rate gives them a leading one.
Concretely, that is where the aggregate 18.8% comes from: it is the second-order rate of the whole portfolio, one in five first-time buyers coming back. The lever is the post-purchase window, and the data on when that second order lands is unambiguous, which is the next section. If you want the number attached to real money, feed your second-order rate and margin into the DTC LTV and repeat-rate calculator and watch what a five-point improvement does to what you can afford to spend on acquisition.
When the second
order actually
happens.
The second order comes back fast, and most brands miss the window. Across 40,397 repeat buyers, half placed their second order within 30 days and three-quarters within 90 days (BS & Co, 2026). Only 3.7% took longer than a year. The curve is steep and front-loaded, which has a direct operational consequence: your post-purchase email flow, not your winback flow, is where the second order gets won.
| Window | Share of repeat buyers | Cumulative |
|---|---|---|
Same day | 6.3% | 6.3% |
Within 1 week | 9.7% | 15.9% |
Within 2 weeks | 13.6% | 29.5% |
Within 1 month | 20.8% | 50.3% |
Within 3 months | 26.1% | 76.4% |
Within 6 months | 10.6% | 87.1% |
Within 1 year | 9.3% | 96.3% |
Over 1 year | 3.7% | 100% |
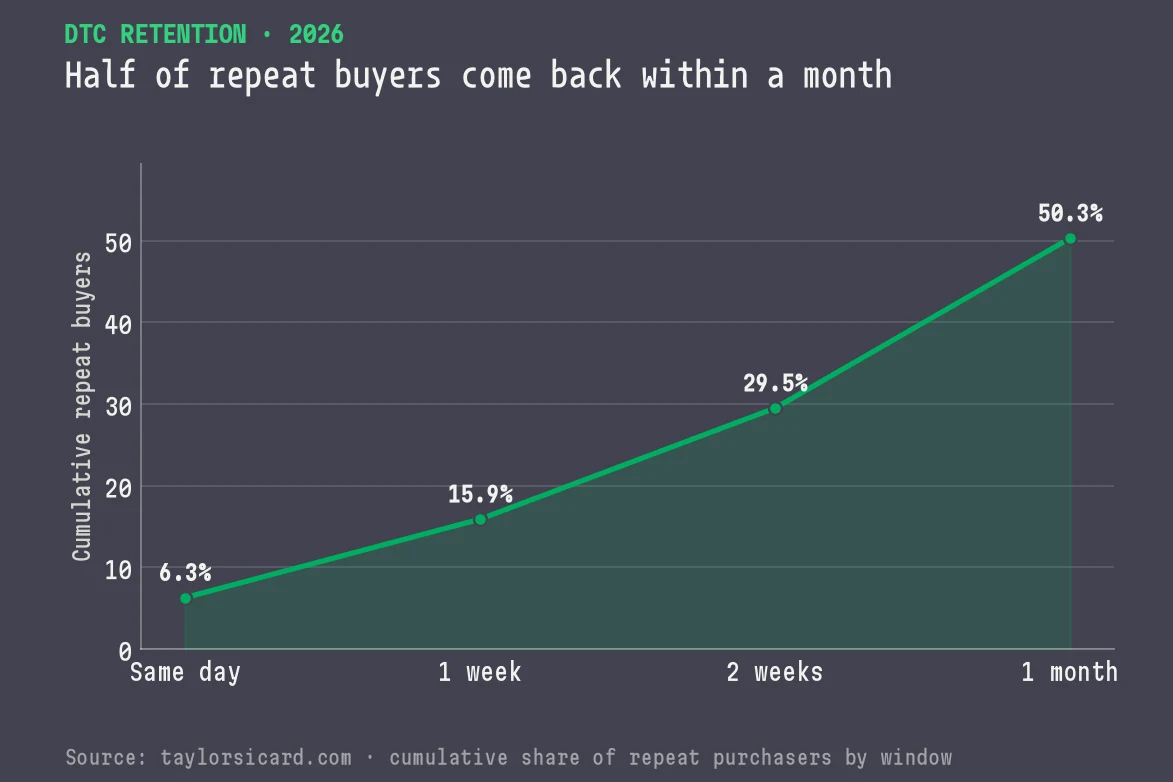
Median time to a second purchase clusters at 15 to 35 days across verticals, and it tracks the consumption cycle. Apparel runs 15 to 27 days (driven by seasonal and gifting needs), consumables 27 to 68 days (how long a supplement bottle or a bag of coffee lasts), and durables 30 days and up with a wide spread, per Eightx's 2026 timing analysis. Use your own median to time the replenishment nudge, and trust it over the average: a long tail of late returners inflates the average time to 50 to 100 days and makes the window look far wider than it is.
Most post-purchase flows run a thank-you at day 0, a shipping note at day 3, a review request at day 7 or 14, then silence until a winback fires at day 90 or 180. But 50.3% of second orders happen inside the first 30 days and 76.4% inside 90. A 7-day post-purchase flow covers only about 16% of the window where the second order actually happens. For most brands the highest-return retention fix costs nothing new: extend the post-purchase sequence to cover the full 90 days, and stop suppressing recent buyers from campaigns during the exact window they are most likely to buy again.
They reorder the
same thing, not
something new.
The second purchase is a reorder, not a cross-sell, and it is not close. Across 7,454 second-purchase journeys, 77% were reorders of the exact same product and only 23% were cross-sells. That flatly contradicts how most post-purchase marketing is built, which leans on "you might also like" product grids optimized for the 23%, not the 77%. For most brands, "ready for another?" beats "have you seen this?"
| Category | Reorder (same product) | Cross-sell (different) |
|---|---|---|
Supplements | 82–93% | 7–18% |
Food & beverage | 45–91% | 9–55% |
Health & wellness | 63–79% | 18–41% |
Apparel | 48–66% | 7–12% |
Home decor | ~0% | ~100% |
The pattern is clean. Supplements are almost pure reorder, 82% to 93%, because the customer found something that works and wants replenishment, not exploration. Food and beverage runs heavily reorder too, with build-your-own brands hitting 91%, which is subscription behavior without the subscription: if your food brand does not offer subscribe-and-save, the data says your customers already want it. Home decor is the exception, at roughly 0% reorder and 100% cross-sell, because nobody buys the same rug twice. This is the one category where "you might also like" is exactly right.
Match the post-purchase experience to the behavior. For consumables and most of fashion, lead with the same product and make reordering one click, then layer cross-sell in later. For durables, do the opposite: show the rest of the catalog, because a returning customer wants a different product, not a second copy of what they own. And if 77% of your returning revenue is a reorder, your campaigns should feature your best sellers, not lead every send with new arrivals.
Subscription retention
and the month-three
cliff.
Subscription changes the retention question from "will they come back?" to "will they cancel?", and the benchmarks live on a monthly-churn basis. Recharge's 2024 State of Subscription Commerce put the consumer-merchant panel at 7.1% monthly churn, split into 4.1% voluntary and 3.0% involuntary (failed payments), and Recurly's consumer-goods benchmark sits near 6.5% per month. On a monthly basis those sound small. Compounded, they are not: 7% monthly churn means you lose more than half a cohort inside a year.
By category, coffee subscriptions churn 5% to 10% monthly and supplements 5% to 8%, with the stickiest replenishment autoships holding 2% to 4% (Eightx subscription churn by category, 2026). Supplement subscriptions retain roughly 45% to 62% at month six. The losses come early: across most categories, 60% to 70% of subscribers are lost between order one and order three, and about 44% of all cancellations happen in the first 90 days, which makes month three the cliff. If you run a subscription, your entire retention program should be concentrated on getting a subscriber past their third box.
A large share of that churn is not a rejection at all. Involuntary churn, the failed-payment kind, runs 20% to 40% of total subscription churn and recovers cheap with basic dunning. Most brands pour effort into winning back customers who chose to leave while ignoring the ones whose card expired. If you are running subscriptions, read the split before you touch anything else: passive versus active subscription churn is the cheapest retention money on the table, and it is the first thing I check.
What a repeat
buyer is actually
worth.
Retention is the profit engine, not a soft metric. The classic Bain research, from Fred Reichheld, found that a 5% increase in customer retention lifts profits by 25% to 95%, because retained customers spend more, cost less to serve, and compound over time (Bain & Company). Acquiring a new customer costs 5 to 25 times more than retaining an existing one, per Harvard Business Review, and the average retained customer is worth about 2.3 times a one-time buyer. That is why the second-order rate moves the whole P&L and belongs on more than the marketing dashboard.
The category effect shows up in revenue concentration, and it is stark. In the BS & Co data, a top consumable brand's repeat buyers were 44% of customers but drove 66.5% of revenue, an over-index of roughly 1.5 times their share. Fashion and durables run closer to 1:1, where repeat buyers spend in proportion to their headcount. So the same 10% loss of repeat buyers is a crisis for a consumable brand and a rounding error for a durables brand. Treat it as a resource-allocation question: know which kind of business you are, and invest in retention accordingly. If repeat buyers carry that much of your revenue, you should know which customers in your order feed are actually your top spenders rather than treating every order the same.
Consumables: repeat buyers subsidize the business (1.5x revenue over-index), so retention is the growth engine and every point of second-order rate is worth real money. Fashion: repeat buyers spend proportionally, so balance retention against acquisition and first-order value. Durables: repeat is a bonus, not the model, so the number to protect is first-purchase AOV and margin, not the repeat rate.
Repeat rate is only half the math. Multiply it by contribution margin and you get what pays back acquisition cost, so a high repeat rate on a thin-margin product still loses money, and a modest repeat rate on a fat-margin product can be a great business. Read this benchmark alongside DTC contribution margin and your category's CAC payback by vertical. Together, those three numbers tell you whether the unit economics close.
Repeat rate below your category's line and no clear reason why? Finding where retention leaks, and what each point of second-order rate is worth to your margin, is work I do with DTC brands past $5M.
How to read
your own repeat
rate.
A benchmark is only useful if you compare it to your own number, measured honestly. The sequence I use with brands takes an afternoon, not a quarter. Once you have the number it becomes a planning input, which is where building a DTC annual plan from Q4 actuals picks it up.
Start by computing your repeat purchase rate on a fixed 365-day window: customers with two or more orders divided by total unique customers. Then compare it to your category's row in the table above, not to the DTC average and not to a subscription-native brand you admire. A 22% repeat rate is a warning sign for supplements and a strong result for home decor.
Then look at where your customers fall out. If your second-order rate is below your category band, the problem is almost always the post-purchase window, not acquisition. Pull your time-to-second-purchase curve, find your median, and check whether your email program is actually active in that window or going silent. If your repeat rate is fine but revenue is not compounding, the issue is order value or margin, not retention. And if you run subscriptions, segment voluntary from involuntary churn before you touch anything, because the cheapest wins are hiding in the failed payments.
The stage you are at changes the priority too. An early brand should obsess over the second-order rate, because it is the leading indicator that the product and the post-purchase experience are working. A scaled brand should watch cohort retention curves for decay that signals the acquisition mix is getting worse. Where a brand sits on that curve is usually a function of its growth stage, and the retention number you should be defending changes with it. For the full cross-ecosystem view of these benchmarks, brand and app side by side, see the 2026 ecosystem benchmark report.
Measure your number the same way every quarter and compare it to your category rather than the average. Then put your effort into the 90-day post-purchase window: half of the second orders you will ever get land within 30 days, and 77% of them are reorders of the same product. If you want the number turned into dollars, run it through the free lifetime-value and repeat-rate calculator to see what your repeat rate is worth in acquisition budget, and the DTC margin calculator carries it down to EBITDA.
Measured. 12-month repeat purchase rate by category, second-order rate, time to second purchase, reorder versus cross-sell share, and monthly subscription churn.
Period. 2026 studies, including a February 2026 study of 156,110 customers. Compiled July 2026.
Sources. BS & Co's 2026 repeat purchase benchmarks, Eightx's 2026 timing and subscription churn analyses, Mobiloud, Bain & Company, Recharge's 2024 State of Subscription Commerce, and Recurly.
Basis. The typical values in Figure 1 are my synthesis of those sources and of operating brands in most of these categories.
Limits. Repeat rate moves with the window and the sample. Section 8 shows how to measure yours on the same basis.
Disclosure. I'm an advisor to Recharge.
Common questions on
repeat-purchase and
retention benchmarks.
What is a good repeat purchase rate for ecommerce?
It depends entirely on what you sell. A repeat purchase rate of 20% to 40% is healthy for most DTC brands, but the real benchmark runs per category. Consumables like supplements and food should target 30% to 45%, beauty and skincare 25% to 40%, apparel 20% to 32%, and durables or home goods 8% to 18%. If you sell consumables and sit below 25%, you have a retention problem. If you sell durables and clear 15%, you are outperforming the norm.
What is the average DTC repeat purchase rate?
It lands between 18.8% and 30% depending on how it is measured. A February 2026 analysis of 156,110 DTC customers by BS and Co put the aggregate at 18.8% on a strict 365-day window, meaning about 81% of customers never place a second order. Broader industry aggregators put the DTC average closer to 25% to 30% over twelve months. The gap comes down to measurement: sample, window, and whether subscription-heavy brands are included.
What is repeat purchase rate by industry?
Consumables run highest because the product gets used up: supplements and food and beverage 30% to 45%, pet 35% to 45%. Beauty and skincare run 25% to 40% and split on whether there is a genuine daily-use hero product. Apparel and fashion sit at 20% to 32%. Home decor, jewelry, and durables sit lowest at 8% to 18%, because nobody buys a second rug or a second engagement ring on a schedule.
What is a second-order rate and why does it matter?
Second-order rate is the percentage of first-time buyers who ever place a second order. It is the earliest reliable read on retention, because you can measure it on a fresh cohort within 90 days instead of waiting a full year. It matters because the jump from one order to two is the hardest and most predictive step: a customer who buys twice is far more likely to buy a third, fourth, and fifth time, so the second-order rate forecasts lifetime value long before the LTV number is real.
When do most second purchases happen?
Fast. Across 40,397 repeat buyers, 50.3% placed their second order within 30 days and 76.4% within 90 days, per BS and Co's 2026 data. Only 3.7% took longer than a year. The median time to a second purchase clusters at 15 to 35 days across verticals: apparel 15 to 27 days, consumables 27 to 68 days, durables 30 days and up. The practical lesson is that most post-purchase email flows end at day 7 to 14 and go silent through the exact window when the second order actually happens.
What is the difference between repeat purchase rate and retention rate?
Repeat purchase rate is the share of customers who placed two or more orders in a period, usually 365 days. Retention rate is a cohort measure: of the customers acquired in a given window, what share is still buying later. They move together but answer different questions. Repeat purchase rate tells you how leaky the bucket is overall; cohort retention tells you how a specific group decays over time. For unit economics, pair repeat purchase rate with contribution margin, because margin times repeat is what pays back acquisition cost.
Turn your repeat rate into a plan
Know your number but not what to do with it? I've operated across most of these categories. Run your repeat rate through the free calculator, then let's talk about the two or three moves that would actually change it.
Run the LTV & repeat-rate tool How I work with DTC brands →