Most benchmark tables price the channel (CPM, CPC, CPA). The lever that moves those numbers is the creative, and almost nobody benchmarks it. In 2026 a good Meta hook rate is about 30% or higher, a good hold rate about 25%, and only around 5% of creatives become winners, so the account that ships the most good ads wins.
- The production benchmark that holds from $100K to $1M a month is roughly one new ad per $3,000 of monthly spend.
- Creative hit rate runs about 3.8% for small accounts to 8.2% for large ones, with a realistic operator target near 15% in a good month.
- Volume beats hit rate: at a 5% win rate, 40 ads a month produce two winners while five ads produce almost none.
Ask a DTC operator what a good CPM or CPA is and they can usually quote you a number. Now ask what a good hook rate is, or how many ads they should ship a month, or what share of their creative is supposed to fail, and the room goes quiet. That gap is strange, because the channel numbers everyone tracks are downstream of the one thing almost nobody benchmarks: the creative itself.
It matters more in 2026 because of Meta's Andromeda update, rolled out in late 2025, which rebuilt delivery so the algorithm reads your creative to decide who sees it. In effect, the creative became the targeting. When the ad content is the input the machine optimizes against, your creative metrics are the leading indicators of what your CPA will do next week. Whether that CPA is affordable is a margin question, and the break-even ROAS math answers it.
This post is the companion to the cost benchmarks. I keep a separate view of what each channel costs in the DTC channel benchmarks, the CPM, CPC, ROAS, and CPA layer. Underneath that layer sit hook rate, hold rate, creative hit rate, how much creative you actually need, and when to kill an ad, and when those numbers are right the channel numbers follow.
Every figure here is triangulated and labeled. The large-sample anchor is Motion's 2026 Creative Benchmarks study of 578,750 creatives across 6,015 advertiser accounts and $1.29 billion in spend. The operator texture comes from practitioners like Curtis Howland of Misfit Marketing, who has spent north of $100M on Meta. Platform signals come from Meta itself. And the operator reads, the healthy-versus-broken calls, come from running creative across a nine-figure brand portfolio. Benchmarks are directional, and your account is the only number that fully applies.
Creative is the number
that moves the other
numbers now.
In 2026, the metric that moves your CPA lives in the first three seconds of your ad. After Meta's Andromeda update, the algorithm processes far more signals about creative content to match ads to people, which means the creative is doing the targeting work that detailed interest stacks used to do. Feed it undifferentiated ads and no audience setting saves you.
That is why creative diagnostics are leading indicators. Hook rate, hold rate, and click-through move before cost per acquisition does, often five to seven days ahead, per practitioner analysis from creative-analytics tools like Sovran and Vaizle. A rising CPA with nothing else changed is usually a creative problem that showed up in the hook rate a week earlier. Read the creative and you can see the CPA coming.
Meta does not publish official numbers for any of this, and there is no dashboard line that says "good hook rate." So the benchmarks below are stitched from the operators and datasets that do measure it across many accounts, and their real job is to give you a directional band and a way to read your own account. Pair them with the qualitative side, the actual ad styles winning right now, which I break down in the field guide to 2026 ad formats.
"Since Andromeda, your creative is your targeting. Which means your creative metrics are no longer vanity numbers. They are the CPA, one week early."
The creative benchmark
tables for Meta ads
in 2026.
Two tables carry the post. The first is the diagnostic ladder: the per-ad metrics you read to know whether a creative is working, with the kill, good, and elite bands for each. The second is the economics of a creative program: how often ads win and how many you need to ship at each spend level. Read the ladder to judge one ad, and read the economics to size the whole operation.
| Metric | What it is | Kill | Good | Elite |
|---|---|---|---|---|
Hook rate Thumb-stop | 3-sec views ÷ impressions | Under 25% | 30–40% | 40%+ |
Hold rate Retention | Viewers past the opening | Under 15% | ~25% | 35%+ |
Click-through rate All CTR | Clicks ÷ impressions | Under 1% | ~2%+ | 3%+ |
Cost per acquisition The outcome | Above break-even ROAS | At target | Clears margin comfortably |
| Monthly spend | Creative hit rate | New ads / week | Ads per winner |
|---|---|---|---|
Under $10K Micro | ~3.8% | ~2–3 | ~26 |
$10K–$50K | ~4–5% | ~4–8 | ~20 |
$50K–$250K | ~5–7% | ~8–15 | ~15–20 |
$250K–$1M | ~7–8% | ~15–25 | ~13 |
Over $1M Enterprise | ~8.2% | ~18–30+ | ~12 |
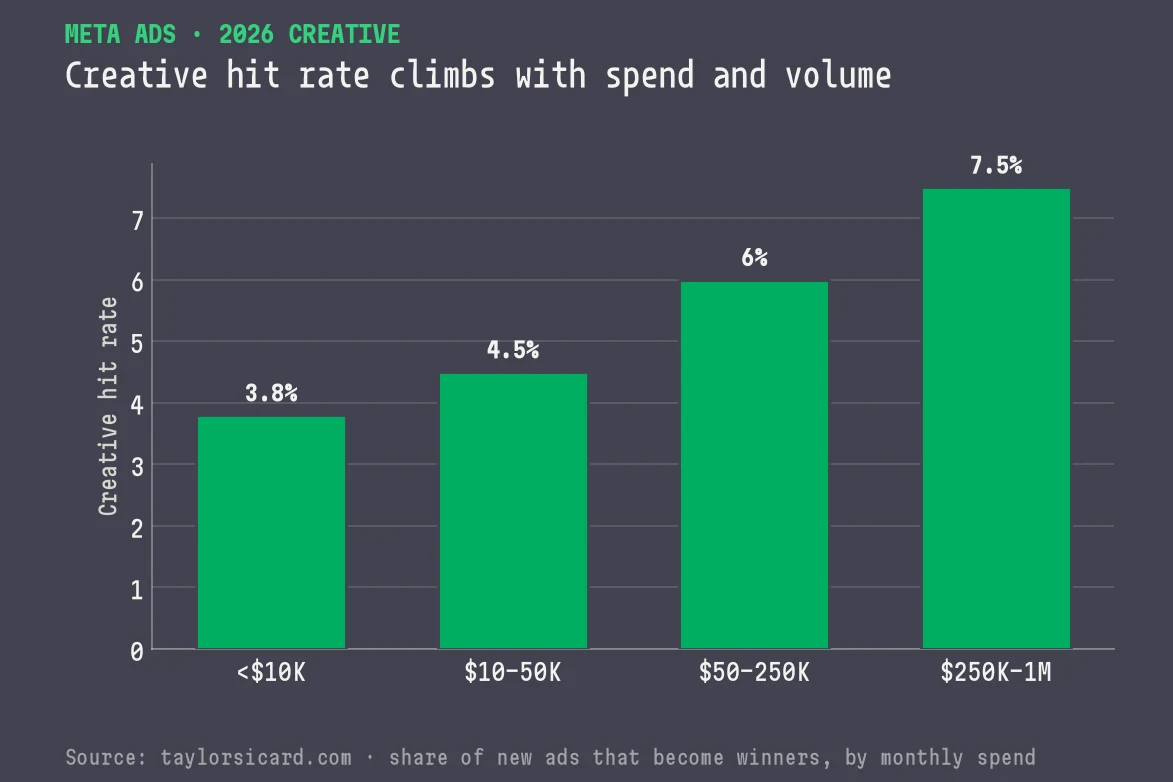
Two things jump out. First, hit rate rises with scale but never gets high: even the biggest accounts, spending over a million dollars a month, only turn about 8% of creatives into winners, per Motion's 2026 data. Most ads lose at every level, by design. Second, the volume column grows faster than the hit-rate column, and the next few sections build on that. Winning comes from shipping enough good ads that the small winning fraction is still a big number, far more than from raising the share of ads that work.
Hook rate: the first
metric that decides
everything after it.
A good hook rate on Meta in 2026 is about 30% or higher. Hook rate, also called the thumb-stop ratio, is the share of people who watch past the first three seconds, calculated as three-second video views divided by impressions. The consensus across creative-analytics sources like Sovran, Vaizle, and adlibrary is a clear ladder: under 25% is the fix-it zone, 30% to 40% is good, and 40% or more is elite, the point where Meta starts treating the creative as relevant and rewards it with cheaper distribution.
Hook rate matters more than any other creative metric for an arithmetic reason: if people do not watch past the hook, nothing else in the ad gets a chance to work, so a weak first three seconds caps everything downstream. This is why operators who track it religiously, like Curtis Howland, use a hard rule: below roughly 25%, kill it and test a sharper first frame before you touch anything else.
Two caveats. Meta publishes no official hook-rate benchmark, which is exactly why the public numbers vary, so treat any band as directional and weigh it against your own account history. And placement changes the math: Reels and Stories, full-screen and fast-swipe, run lower hook rates than in-feed video, so a 30% hook in Stories is not the same as 30% in feed. Benchmark within placement, not across it.
Hold rate and the chain
that ends at your
CPA.
A healthy hold rate is roughly 25% or higher. Hold rate measures the viewers who keep watching past the opening seconds, the ones the hook actually earned, and it is the second rung on the diagnostic ladder. The chain runs in order: the hook earns the stop, the hold earns the watch, the click-through earns the click, and cost per acquisition is the outcome all three feed into. Each rung only gets a shot if the one above it held.
Reading the ladder in sequence is what makes it useful, because it localizes the problem. A high hook rate with a collapsing hold rate means your first frame is writing a check the rest of the ad cannot cash, so fix the middle, not the opening. A strong hook and hold with a weak click-through usually means the offer or the call to action is the leak, not the creative craft. The ladder turns "this ad is not working" into "this ad breaks at rung three."
Because these metrics move before the money does, they work as an early warning. Hook and hold rate often shift five to seven days ahead of CPA, per practitioner analysis, so a fatiguing creative shows up in a softening hold rate before it shows up in your cost per purchase.
Creative hit rate: why
most of your ads are
supposed to lose.
Across Motion's 2026 Creative Benchmarks study of 578,750 creatives and 6,015 accounts, only about 5% of creatives qualify as winners. The rate rises with spend, from roughly 3.8% for brands under $10K a month to about 8.2% for those over $1M, but it never gets high. Curtis Howland, working from his own accounts, puts a realistic operator figure closer to 15% in a good month. Whichever figure you use, most of your ads will lose as a matter of course.
The distribution follows a power law. A small share of ads does most of the work: roughly 1% to 2% of creatives drive close to half of all spend in a mature account. With a split that lopsided, a 15% hit rate is what a healthy testing program looks like when it is honest about how rare winners are. Teams that expect a 50% success rate end up killing good programs out of impatience.
The practical consequence is a rule I hold to hard: build off winners, and treat individual losers as noise. One losing ad tells you almost nothing, because a single ad's poor day is mostly variance. The signal lives in the aggregate, in the patterns across many losers and the shared traits of the few winners. So skip the autopsy on every loser, reverse-engineer the winners, and ship more shots on that goal.
Chasing a higher hit rate can backfire. An account with a 5% hit rate shipping 40 ads a month produces two winners, while an account with a 10% hit rate, twice as efficient, shipping only five ads a month produces half a winner. The second team is better at making ads and worse at growing, because winners are an output of volume times hit rate, and volume is the lever you actually control. When a creative program stalls, more shots fix it far more often than better aim does.
How much creative you
actually need to
ship.
The production benchmark that holds across most of the market is about one new ad per $3,000 of monthly Meta spend. That means a brand spending $30K a month needs roughly 10 new ads, $100K needs about 33, $300K needs around 100, and $1M needs north of 330. This is the rule Curtis Howland uses across accounts, and Motion's data corroborates the shape of it, from about 2.8 new creatives a week for sub-$10K brands up to 18.85 a week for brands over $1M.
That number is sized to two forces working against you: monthly creative churn of roughly 20% to 35% as ads fatigue and get pulled, and a hit rate around 5% to 15%. To hold your winner count steady while fatigue retires your current champions, you have to keep feeding the top of the funnel. Produce far below the benchmark and you slowly starve the account, which plateaus while your competitors keep shipping.
Two of my free tools turn this into a budget you can defend. The max allowable CAC tool sets the ceiling every winning ad has to clear, and the break-even ROAS tool converts your margin into the return those winners need. Creative volume is a cost, so it has to be sized against the economics, not just the spend. A production plan you cannot afford is as broken as a creative team that ships nothing.
The static format mix
behind the volume
numbers.
Most of that volume is static, not video. In a study of 67,852 active ads across 106 DTC brands, Curtis Howland found static images made up about 55.6% of all ads and 64.8% among DTC brands specifically. Far from a cheap fallback, static is the primary way brands produce the diversity Andromeda rewards, because a static takes 30 to 60 minutes to make against four to eight hours for a video, so a small team can ship 15 to 25 static variations a week versus three to five videos.
The benchmark inside the benchmark is diversity. A healthy account runs 6 to 8 distinct static formats at once and ships 12 to 15 new statics a week, spread across format, angle, and audience rather than the same idea recolored. Andromeda reads near-duplicate ads as sameness and suppresses them, so shipping 20 tweaks of one winner is not real volume. For the qualitative version of which formats are actually working, from spreadsheet ads to founder cuts, see the 2026 ad-styles field guide.
The split most DTC accounts settle on is roughly 60% to 70% static and 30% to 40% video, but your own data should set it. Look at where your winners actually come from and allocate production to match, rather than inheriting a rule of thumb. The format mix is there to give the algorithm enough different shots that the 5% that win have room to appear.
Reading fatigue, and
when to actually kill
a creative.
The fatigue signals are specific and worth memorizing. A creative is tiring when its click-through rate falls below about 1%, when CTR drops 20% or more week over week, when prospecting frequency climbs past 3.0, or when CPA rises with nothing else in the account changing. Any one of those is a warning; two together is a decision. At scale, the practical refresh cadence that keeps an account fresh is every 7 to 14 days, per operator practice.
The harder discipline is not killing too early. An ad needs enough data before its numbers mean anything, roughly 5 to 10 conversions, or spend equal to about 5 to 10 times your target CPA, before you should trust the read. Killing a creative after $200 and zero purchases is deciding on noise, and it is the single most common way teams murder ads that were about to work. Scale first, then judge.
This is where the creative-versus-media-buyer fight usually lives, and both sides are half right. The media buyer who cuts on day one is often reacting to variance, and the creative who insists every ad needs three weeks is often defending a genuine loser. The fatigue thresholds above exist to settle that argument with numbers instead of opinions: enough data to trust the read, clear signals for when the read has turned.
How to read these
numbers without
fooling yourself.
Meta publishes no official benchmark for hook rate, hold rate, or creative hit rate, so every public number here is a directional band stitched from third-party datasets and operators. The only benchmark that fully applies to your ads is your own account history. Use the outside numbers to know whether you are in the right neighborhood, then trust your own baseline to know whether a specific ad is good for you.
The second trap is judging creative before it has earned a verdict. Read the metrics in order of what they can tell you: scale first, then efficiency, then the diagnostics. A 60% hook rate on an ad that has spent $200 means almost nothing, because it has not faced a cold audience at volume yet. Hook rate is a diagnostic, and on an unscaled ad it is mostly noise.
Third, hold the whole thing to your economics. A great hook rate that produces expensive purchases is a good ad at making people watch and a bad ad at making you money. The creative ladder tells you why an ad performs the way it does, but whether that performance is good is a margin question, which is why this creative layer only makes sense sitting on top of your unit-economics benchmarks.
You know your hook and hold rates, but is the CPA they produce affordable? Tying creative volume to contribution margin is planning work I do with DTC brands past $5M.
Turning creative
benchmarks into an
actual plan.
Benchmarks only matter if they change the next dollar. The creative numbers stack into three connected layers, and the plan lives in reading them together. Your hit rate and production benchmark set how much creative you need to make. Your fatigue thresholds set how often you refresh it. And your margin sets the CPA those winners have to clear, which is what turns a "good ad" into a profitable one.
Run the layers in order. First, the channel: what each channel costs to reach and convert, which is the channel benchmark table. Second, the creative: the hook, hold, hit rate, and volume on this page, which is the lever that moves the channel cost. Third, the economics: the unit-economics benchmarks that decide whether any of it clears margin. The middle layer is the one brands skip, and skipping it means optimizing spend into ads that were never going to work.
In 2026 the creative is the targeting, which makes your creative metrics the leading indicators of everything downstream. A good hook rate is around 30%, a good hold rate around 25%, and only about 5% of your ads will win, so the account that ships the most good, different ads takes the market. Volume beats a better hit rate and diversity matters more than volume, but your own margin is the only judge that counts.
If you want a second set of eyes on your creative system, whether your problem is quality or throughput, whether your hit rate is healthy for your spend, and whether the ads that win actually clear your margin, that is the work I do. The DTC growth consultant exists for exactly this, and the Meta versus Google decision is a good next read on where creative-led demand fits the whole channel mix.
Measured. Hook rate, hold rate, CTR and CPA bands; creative hit rate, testing volume and static-to-video mix by spend tier; and the thresholds that signal fatigue.
Period. 2026 data, compiled July 2026.
Sources. Motion's 2026 Creative Benchmarks (578,750 creatives across 6,015 ad accounts), Curtis Howland's operator data and his study of 67,852 ads across 106 DTC brands, and practitioner analysis from Sovran, Vaizle and adlibrary. Meta publishes no official creative benchmark.
Basis. The calls on what's healthy and what's broken come from running creative across a nine-figure brand portfolio.
Questions operators ask
about creative
benchmarks.
What is a good hook rate for Meta ads in 2026?
A good hook rate, the share of viewers who watch past the first three seconds (three-second views divided by impressions), is about 30% or higher in 2026. Roughly 25% is the floor, 30% to 40% is good, and 40% or more is elite, the zone where Meta tends to reward the creative with cheaper distribution. Meta publishes no official benchmark, so compare against your own account history and expect Reels and Stories to run lower than in-feed video.
How many ad creatives should I test on Meta each month?
The durable rule is about one new ad per $3,000 of monthly Meta spend, so a brand spending $100,000 a month needs roughly 33 new ads and one at $300,000 needs about 100. Motion's 2026 data lines up, from about 2.8 new creatives a week for sub-$10K brands to 18.85 for brands over $1M a month. Volume matters more than hit rate: at a 5% win rate, 40 ads produce two winners while five ads produce almost none.
What is a good creative hit rate or win rate?
Across Motion's 2026 Creative Benchmarks study of 578,750 creatives and 6,015 accounts, about 5% of creatives qualify as winners, ranging from roughly 3.8% for brands under $10K a month to 8.2% for those over $1M. Operators like Curtis Howland put a realistic figure closer to 15% in a good month. Either way most ads lose, because a small 1% to 2% of creatives drive close to half of all spend. That is how a power law behaves.
What is a good hold rate for a Meta video ad?
Hold rate measures the viewers who keep watching past the opening, and a healthy figure is roughly 25% or higher in 2026. It sits one rung below hook rate on the diagnostic ladder: the hook earns the stop, the hold earns the watch, the click-through earns the click, and the cost per acquisition is the outcome. Hook and hold rate often move five to seven days before CPA does, which makes them early warning signals.
How much does DTC ad creative cost, and how much do I need?
Plan production against spend, not a flat budget: about one new ad per $3,000 of monthly Meta spend is the working benchmark, split roughly 60% to 70% static and 30% to 40% video for most DTC accounts. Static ads cost far less to make, 30 to 60 minutes each versus four to eight hours for video, which is why static runs 55% to 65% of the ad mix across DTC brands. Budget for churn too, since 20% to 35% of creative gets refreshed monthly.
Is your creative problem quality, or throughput?
I've judged the ads that spent real money across a multi-brand portfolio, so I know how often a stalled account is a volume problem wearing a quality costume. If you want to know whether your hit rate is healthy for your spend, and whether your winners actually clear your margin, start with the max allowable CAC calculator, then let's talk. The form takes two minutes.
Start a conversation Run the Max Allowable CAC calculator →