There is no single DTC CAC, ROAS, or CPM. Each is a property of the channel. In 2025 Meta ecommerce CPM ran near $16.80 and peaked at $22.98 in Q4, TikTok sat near $13.26, Google Shopping clicks held around $1, and owned email and SMS carried effectively no acquisition cost at all. Blended DTC CAC has climbed 40% to 60% since 2023.
- Paid social (Meta, TikTok) is a volume engine at roughly 2x reported ROAS and needs 3x to 4x to clear a healthy margin.
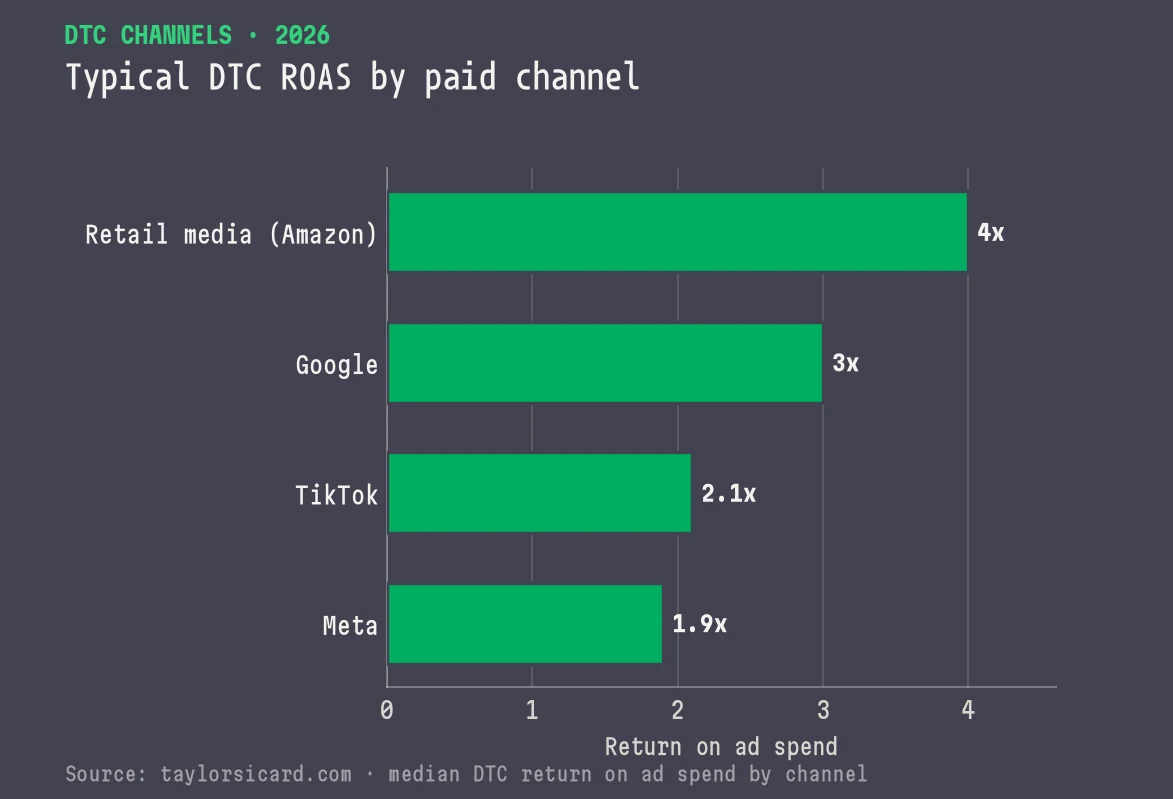
- Google captures existing intent at the best conversion rates; retail media on Amazon is the fastest-growing line at a 25% to 30% advertising cost of sale.
- Affiliate pays on outcome (3% to 10% commission), and owned email/SMS posts the highest returns of any channel because it monetizes customers you already acquired.
Every DTC operator I talk to asks some version of the same question. "What's a good CAC?" Or "is a 2.5x ROAS bad?" Or "why has my CPM doubled?" And the honest reply is always the same: good for which channel? Because there is no single acquisition cost, no single return, and no single CPM for a direct-to-consumer brand. Every one of those numbers is a property of the channel you're spending in, and the spread between channels is enormous. A dollar behaves completely differently on Meta than it does on Google, on TikTok, on Amazon, in an affiliate program, or in an email flow.
Here is the shape of the market in 2026. Blended DTC customer acquisition cost has climbed roughly 40% to 60% since 2023, per aggregate ecommerce benchmark data. Meta ecommerce CPMs hit all-time highs, peaking near $22.98 in the fourth quarter of 2025 per Triple Whale, and Google Shopping cost per click jumped more than 33% in 2025. Costs went up almost everywhere. But they went up unevenly, and the brands that win are the ones that know exactly what each channel costs, what it returns, and which number to trust.
I've spent real money in every channel covered below. Running portfolios of consumer brands to nine-figure revenue meant sitting over the media budgets across a dozen brands at once, deciding where the marginal acquisition dollar went and watching what it actually returned once the platform-reported number met the bank account. That gap, between what a channel says it did and what it truly contributed, is the single most expensive thing most brands never measure. It's woven through every row of the table below. Closing that gap is a tooling decision, and the three attribution platforms brands actually shortlist are compared here.
This is the per-channel benchmark table. Read it, then lift the numbers you need. For each of the six major channels a DTC brand runs, I've pulled the current, sourced figures for CPM, cost per click, ROAS, conversion rate, and where CAC actually lands, then explained what the numbers mean and where they mislead. If you want to know what you should be paying, and whether your channel plan is built on real economics or on hope, start here.
One caveat before the data. Every figure here is grounded in published 2025 benchmark reports (Triple Whale, WordStream, Klaviyo, Impact, Sequence Commerce) or attributed explicitly to my own operating experience. Benchmarks are directional, not a quote on your brand: your vertical, price point, margin, and creative all move these numbers. Treat the table as the shape of the market, and the reasoning around it as the part you can actually act on.
There is no single DTC
CAC. There is a CAC
per channel.
Start with the number everyone quotes wrong. Across aggregate 2025 ecommerce benchmarks, blended DTC customer acquisition cost ran roughly $68 to $84, while Shopify's own data pegged average US DTC retail CAC nearer $226 in 2024, up about 7% year over year. Those two figures are not in conflict. They describe different mixes of channel, vertical, and price point. A food-and-beverage brand living on Meta prospecting and email has a very different blended CAC than an electronics brand leaning on high-CPC Google search. The blended number is an average of averages, which means it's true for nobody in particular. Your own floor is the number that matters, and how break-even ROAS and MER fit together is where to work it out.
The more useful frame is that CAC is set at the channel level, then blended up. Paid social manufactures demand, so its cost per new customer is high and its reported conversion is modest. Search captures demand that already exists, so it converts better and often costs less per order. Retail media rents you a shelf inside someone else's marketplace. Affiliate pays only when a sale happens. Owned email and SMS don't acquire anyone at all: they re-monetize customers you already bought. That's six channels with six completely different cost structures, and any single "DTC CAC" figure hides all of it.
By vertical the spread widens further, which is why I keep a separate view of how long CAC takes to pay back in each vertical. Food and beverage sits near the bottom at roughly $45 to $53 per customer, while electronics can run past $377 and luxury averages around $175. Your channel benchmark and your vertical benchmark interact: the same channel costs more in a category with worse conversion and higher price sensitivity. Read the table below as the channel layer, and layer your vertical on top of it.
"The blended DTC CAC is an average of averages. It's true for nobody in particular. The number that matters is set one channel at a time."
The per-channel
benchmark table for
DTC in 2026.
This is the core of it. The first table is the cost-and-return view: what it costs to reach and click each channel, and the return DTC brands typically see. The second is the acquisition view: how each channel converts and where a true new-customer CAC lands. Read them together. A channel with a cheap click and a great reported ROAS can still be a poor acquisition channel once you account for how much of that return was demand you'd have captured anyway.
| Channel | CPM | Cost per click | Typical DTC ROAS |
|---|---|---|---|
Meta (Facebook / Instagram) Paid social prospecting | ~$16.80 (Q4 peak $22.98) | ~$1–$2 | ~1.9x median, aim 3–4x |
Google (Search & Shopping) Intent capture | Priced on clicks | ~$1 Shopping · $3–$4 non-brand search | ~2–4x, down ~10% in 2025 |
TikTok Paid social, discovery | ~$13.26 (+16% YoY) | ~$1 (range $0.20–$2) | ~2.0–2.2x, softening |
Retail media (Amazon) Sponsored Products | Priced on clicks | ~$1.12 (+15.5% YoY) | ~4x at 25% ACoS |
Affiliate & partnerships Pay-on-outcome | No media cost | Commission 3–10% of sale | $5–$12 per $1 (4–6x yr 1, 9–12x mature) |
Email & SMS (owned) Retention & repeat | No media cost | No per-click cost | Highest of any channel |
| Channel | On-platform CVR | Reported cost per order | New-customer CAC read |
|---|---|---|---|
Meta (FB / IG) | ~1.6% median | ~$33 CPA | Understated vs true blended CAC |
Google Search & Shopping | ~2.8% search · 1.9% Shopping | ~$39 Shopping · $45 search | Nearest to a true CAC; captures intent |
TikTok | ~2.0% | ~$33 CPA | Reach-priced; incrementality varies |
Retail media (Amazon) | ~10% on-platform | 25–30% ACoS | Blends into TACoS, not fully incremental |
Affiliate | ~1–2% | Commission per sale | Outcome-priced; test incrementality |
Email & SMS (owned) | Flows ~1.2% placed-order | ~$0 acquisition | Not a new-customer channel |
Two things jump out of these tables. First, the paid channels have converged on expensive: Meta, TikTok, and Amazon all pushed CPM or CPC up double digits in 2025, and Google's clicks climbed too. There is no more cheap channel to arbitrage. Second, the returns are not comparable across rows, and that is the trap. Meta's reported 1.9x and email's astronomical ROAS are measured in totally different ways and mean totally different things. The sections below take each channel in turn, then Section 09 explains how to read the numbers without fooling yourself.
Meta: the volume
engine that keeps
getting pricier.
Meta is still where most DTC brands buy the bulk of their new customers, and it's still the most expensive it has ever been. Per Triple Whale's full-year 2025 data, ecommerce CPM ran about $16.80, up roughly 18% year over year, and it peaked at an all-time high near $22.98 in the fourth quarter as the holiday auction crowded. The median ecommerce ROAS across the platform sat at about 1.93, with a median conversion rate near 1.57% and median click-through around 2.19%. Cost per purchase averaged close to $33.
Read those numbers carefully, because a 1.93 median ROAS scares founders who don't understand the frame. That is the platform-attributed number across a huge sample, and it includes plenty of brands running badly. A well-run Meta account clears well above it. But the operator reality is different. For a normal DTC brand with a 55% to 65% gross margin, you generally need a genuine 3x to 4x ROAS on Meta to clear a healthy contribution margin after product, shipping, and payment costs. A reported 2x is often a break-even-or-worse day once the real costs and the attribution inflation come out.
Meta's role in a 2026 plan is unchanged: it's the volume engine. Nothing else scales net-new demand as fast or as far. The lever that moves its cost, though, is the creative, not the audience, which is why I keep a companion set of Meta creative benchmarks for hook rate, hit rate, and production volume. But it's a volume engine you have to feed at a rising price, which is exactly why the owned channels at the bottom of the table matter so much. The math only works if the customers Meta buys you get monetized again, cheaply, through email, SMS, and repeat purchase. Meta acquires and owned retains, and the operators who make the math work run the two as one system rather than two separate line items. That relationship is the spine of any real why channel mix is strategy.
Google: paying to
capture demand you
didn't create.
Google is a fundamentally different transaction from paid social. On Meta you pay to interrupt someone and manufacture interest. On Google you pay to be there when someone already wants what you sell. That's why the conversion rates are better and the cost per order is often lower. Per WordStream's 2025 benchmarks, ecommerce Shopping ads convert around 1.91% and search around 2.81%, versus Meta's 1.57%. Shopping delivers roughly 43% lower cost per click than search and a cheaper cost per acquisition, about $38.87 for Shopping against $45.27 for search.
On price, non-brand ecommerce search clicks generally run $3 to $4, while Google Shopping clicks sit closer to $1, against an all-industry average CPC of about $5.26. The catch in 2025 was inflation and efficiency slippage: Google Shopping CPCs jumped more than 33% and platform ROAS slipped roughly 10%, so even Google's better economics got tougher. A solid retail ROAS target here is 2x to 4x, and because Google is capturing existing intent, its reported number is usually closer to a true incremental CAC than paid social's is.
The strategic point is that Meta and Google are not substitutes, they're complements, which is the whole argument in the Meta versus Google decision for DTC brands. Meta creates the demand; Google harvests the searches that demand generates, including people searching your brand name after seeing a Meta ad. Run them as a loop and the blended efficiency beats either one alone. Judge Google search on brand versus non-brand separately, though: brand search is cheap and converts beautifully but is largely harvesting demand you already paid to create elsewhere, so don't let it flatter your account-level ROAS.
TikTok: still the
reach bargain, but the
edge is narrowing.
TikTok remains the closest thing to a reach bargain among the big paid channels, but the discount is shrinking. Per Triple Whale's full-year 2025 data, TikTok CPM ran about $13.26, up roughly 16% year over year, which keeps it below Meta's ecommerce CPM. Cost per click hovered near $1, in a wide $0.20 to $2 range depending on objective and creative. The softening showed up downstream: conversion rate slipped about 6% to around 2.01%, ROAS declined roughly 6% to about 2.21, and cost per acquisition landed near $32.74.
The pattern is a platform maturing. TikTok in 2025 still offered cheaper reach than Meta, but it started showing the same efficiency pressure that hit the older platforms first: rising CPMs, slipping conversion, compressing returns. A healthy prospecting ROAS on TikTok is roughly 2.0x to 3.5x, and the brands doing well there are still winning on creative-native content rather than repurposed Meta ads. The reach is real, but it is increasingly reach you have to convert with genuinely native content, not just cheap impressions.
For most DTC brands, TikTok in 2026 is a strong secondary prospecting channel, not a primary one. It earns a place in the mix when your product demos well in short-form video and your creative team can actually feed it native content at volume. It struggles when a brand treats it as a cheaper Meta and dumps recycled static ads into it. The CPM advantage is genuine but thin, and it evaporates the moment your conversion rate underperforms, because a cheap impression that doesn't convert is not cheap at all.
Retail media: the
fastest-growing line
in the plan.
Retail media, led by Amazon Sponsored Products, has moved from a side bet to a core line for a lot of DTC brands. Per Sequence Commerce and SalesDuo's 2025 data, the average advertising cost of sale (ACoS) on Amazon ran about 25% to 30%, which corresponds to roughly a 3.3x to 4x return on ad-attributed sales, with cost per click near $1.12, up about 15% in 2025. On-platform conversion is the standout: Sponsored Products convert around 10%, far above any off-platform channel, because you're reaching shoppers with their wallet already open inside a marketplace.
Two metrics matter here and they tell different stories. ACoS measures spend against the revenue the ads directly drove. TACoS, total advertising cost of sale, measures ad spend against your total Amazon revenue, and a healthy TACoS runs about 10% to 15%. The gap between them is the point: strong retail media doesn't just win the click it paid for, it lifts organic rank and total sales, so a rising TACoS with flat ACoS can be a warning that your organic demand is thinning. Watch both, not just the flattering one.
The reason retail media keeps growing is demand: about 59% of DTC brands named it among their most important growth channels for the back half of 2025. But there's a strategic tax. Every dollar you build on Amazon is a dollar of customer relationship you don't fully own, because the marketplace keeps the data and the loyalty. Retail media is excellent for incremental sales and product discovery, and dangerous as a foundation, for the same reason your owned channels are so valuable: on Amazon, the customer is Amazon's, not yours.
Affiliate: the channel
that only bills you
when it works.
Affiliate and partnership marketing is the one channel that fundamentally changes the risk equation, because you pay on outcome. Instead of buying impressions and hoping, you pay a commission only when a sale closes, typically 3% to 10% of the sale for retail and ecommerce programs. That structure is why the reported returns look so strong. Per Advertise Purple's data, year-one DTC affiliate programs typically produce a 4:1 to 6:1 ROAS, and mature programs with an optimized partner mix routinely reach 9:1 to 12:1. Impact's 2025 benchmark put overall retail affiliate return near $11 per dollar, though it varies hard by category (clothing and accessories near $12, food and drink near $5).
The number that looks too good is the number to interrogate. A 10:1 affiliate ROAS is real spend efficiency, but a big share of affiliate-attributed sales are people who were going to buy anyway and passed through a coupon or loyalty site on the way to checkout. That's the incrementality question, and it's the entire game in affiliate. A well-run program pays for genuinely new demand from content partners and creators; a lazy one pays a commission on your own existing customers who found a discount code. The headline ROAS can't tell those apart, so you have to.
Run correctly, affiliate is one of the most capital-efficient channels in the mix, precisely because the downside is capped: no sale, no cost. It rewards partner curation over spend volume, and it compounds as your program matures and the right creators and publishers accumulate. It's rarely a primary acquisition channel for an early brand, but for a brand past its first scale it's a high-return, low-waste layer that most operators under-invest in, largely because it takes relationship work rather than a media budget.
Email and SMS: the
channel that doesn't
have a CAC.
Now the channel that breaks the table on purpose. Email and SMS have no cost per new customer, because they market to people who already gave you their contact information, which means you already paid to acquire them somewhere else. Their cost is the platform subscription plus the effort of building the list. That's why they post the highest returns of any channel by a wide margin, and why smart operators treat them as the reason paid acquisition can afford to run tight.
The numbers are stark. Per Klaviyo's benchmark data across more than 183,000 brands, email flows generate roughly 18 times the revenue per recipient of one-off campaigns, and drive about 41% of total email revenue from just 5.3% of sends. Automated flows post an average placed-order rate near 1.23%, with the top 10% of brands hitting 4.64%. SMS follows the same shape: flows produce roughly 8 times the revenue per recipient of campaigns, and SMS flows drive about 45% of SMS revenue from only 7.6% of sends. The leverage is in the automations, not the blasts.
The strategic role of owned channels is to raise lifetime value, which quietly raises what you can afford to pay everywhere else. If your welcome flow, abandoned-cart series, and post-purchase sequence reliably convert and re-order the customers Meta buys you, then your true blended CAC per lifetime customer falls even as your paid CAC per first order rises. This is the lever the whole system turns on, and it's the same logic as protecting your contribution margin on every order: owned revenue is the cheapest margin you have, so build the machine that captures it before you scale the paid spend that feeds it.
How to read the
numbers without
fooling yourself.
The most expensive mistake in this whole exercise is comparing the ROAS numbers across rows as if they mean the same thing. They don't. Meta's 1.9x, Amazon's ACoS-implied 4x, and email's enormous return are measured three different ways against three different denominators. A platform-reported ROAS credits the platform for every sale it can claim, which is why every channel's self-reported number, summed up, tends to exceed your actual revenue. If your platforms collectively claim 130% of your sales, the extra 30% is double-counting, and it's coming out of your margin.
Two habits fix most of it. First, hold every paid channel to your contribution margin, not to a channel-average ROAS. The break-even ROAS you need is simply one divided by your contribution margin: a 40% contribution margin needs a 2.5x ROAS just to break even on the order, so a "2x" day is a loss. Second, judge acquisition on incrementality, not attribution. The real question for any channel is how many sales you'd have lost without it, which is a very different number from how many it claimed. Brand search, retargeting, and affiliate coupon sites are the usual suspects for claiming credit for demand you already owned.
Before you trust a channel's number, ask three things. One: what is my break-even ROAS at this margin, and is the reported return actually above it once real product, shipping, and payment costs come out? Two: how much of this channel's attributed revenue is incremental, versus demand I already paid to create elsewhere? Three: is this an acquisition channel or a monetization channel, because holding email to a paid-CAC standard, or Meta to email's ROAS, compares things that aren't comparable. Answer those and the table stops being a list of numbers and becomes a plan.
Turning these
benchmarks into a
channel plan.
Benchmarks are only useful if they change what you do with the next dollar. The way I've built channel plans across a multi-brand portfolio is to start from the constraint, not the channel: figure out the most you can afford to pay for a customer given your margin and payback tolerance, then work backward to where that dollar buys the most durable growth. If a channel's real, incremental cost per customer sits under your ceiling, you scale it. If it sits above, you fix the economics or you cap the spend. The benchmarks tell you what "normal" costs; your margin tells you what you can afford.
Two free tools do exactly that math. The CAC ceiling calculator works out the ceiling: the most you can spend to acquire a customer and still hit your payback and margin targets, which is the number every channel in this table has to clear. The break-even ROAS calculator converts that into the return you need on any paid channel at your specific margin, so you can tell in ten seconds whether a reported 2.4x day was actually profitable. Run your real numbers through both before you read another benchmark, because a benchmark you can't afford is just someone else's average.
The plan that comes out of this is almost never "pick the cheapest channel." It's a portfolio: Meta and TikTok for volume at a price you hold to your margin, Google to harvest the intent that volume creates, retail media for incremental marketplace demand you treat as rented, affiliate as a capped-downside layer, and owned email and SMS as the monetization engine that makes the whole thing profitable. The benchmarks price each piece for 2026. The judgment is in how you weight them against your own economics, and that's the part worth getting a second set of eyes on.
It comes back to one idea: there is no good CAC, no good ROAS, and no good CPM in the abstract. There is only what a channel costs, what it returns incrementally, and whether that return clears your margin. In 2026 every paid channel got more expensive, the reported returns compressed, and the owned channels quietly became more valuable than ever because they cost nothing to run. The brands that come out ahead aren't chasing the cheapest impression. They read the true cost of each channel, trust the incremental number over the attributed one, and build the owned engine that lets the paid engine run.
If you want a second set of eyes on your channel economics, whether your reported ROAS is real, where your true CAC sits, and which channel is quietly losing you money at scale, that's the work I do. The fractional DTC growth consultant exists for exactly this, and the channel mix strategy piece is a good next read on how to weight the table above into an actual budget.
Measured. CPM, CPC, ROAS, conversion rate and cost per order for Meta, Google, TikTok, Amazon, affiliate, and email and SMS. Also blended CAC and CAC by category.
Period. Mostly full-year 2025 data, compiled July 2026.
Sources. Triple Whale's full-year 2025 data for Meta and TikTok, WordStream's 2025 benchmarks for Google, Sequence Commerce and SalesDuo for Amazon ACoS, Advertise Purple and Impact for affiliate, Klaviyo's benchmark data for email and SMS, and Shopify for US DTC CAC.
Basis. The ROAS targets and the operator reads come from running media budgets across a dozen brands at once.
Limits. Where the text doesn't name a publisher, treat the figure as a directional range.
Questions operators ask
about channel
benchmarks.
What is a good CAC by channel for a DTC brand in 2026?
There is no single good CAC, because acquisition cost is a property of the channel, not the brand. On Meta and TikTok, the platform-reported cost per purchase runs near $33, but true blended new-customer CAC lands higher once you account for incrementality. Google Shopping reports roughly $39 per order and search closer to $45, and those sit nearest to a true CAC because they capture existing demand. Retail media on Amazon runs a 25% to 30% advertising cost of sale rather than a flat CAC. Owned email and SMS carry no new-customer CAC at all. Blended DTC CAC across aggregate 2025 benchmarks ran roughly $68 to $84, while Shopify pegged average US DTC retail CAC near $226 in 2024, so which figure applies depends entirely on your channel and vertical mix.
Which paid channel has the lowest CAC for ecommerce?
Among the pure acquisition channels, Google Shopping tends to deliver the lowest cost per order, roughly $39 versus about $45 for search per WordStream's 2025 data, and it holds clicks near $1 while non-brand search runs $3 to $4. That's because Google captures existing purchase intent rather than manufacturing it. Owned email and SMS still beat every paid channel on cost, because they carry no per-customer acquisition cost. They aren't acquisition channels, though. They monetize demand you already bought, which is why the sharpest brands treat cheap owned revenue as the reason paid acquisition can afford to run tight on the first order.
What is a good ROAS by channel?
Reported ROAS varies widely by channel. Meta's median ecommerce ROAS ran about 1.93 in 2025 per Triple Whale, and a healthy target is 3x to 4x to clear a normal contribution margin. Google retail sits around 2x to 4x. TikTok posted roughly 2.0 to 2.2 and is softening. Retail media on Amazon at a 25% advertising cost of sale implies about 4x on ad-attributed revenue. Affiliate returns the most on paper, from 4:1 to 6:1 in year one up to 9:1 to 12:1 for mature DTC programs. The key is that these numbers are not comparable, because paid social reports inflated attributed ROAS while owned and affiliate returns are measured differently. Judge each against your contribution margin, not against each other.
What is the average CPM on Meta, TikTok, and Google in 2026?
Meta ecommerce CPM ran roughly $16.80 across full-year 2025 per Triple Whale, up about 18% year over year, and peaked at an all-time high near $22.98 in Q4 2025. TikTok CPM sat near $13.26 for 2025, up about 16% year over year, keeping a reach-cost advantage over Meta. Google Search and Shopping are priced on cost per click rather than CPM, at roughly $1 for Shopping and $3 to $4 for non-brand search, with the all-industry average CPC near $5.26. Every one of these rose in 2025, which is the core reason blended DTC CAC has climbed 40% to 60% since 2023.
Do email and SMS have a CAC?
Not in the paid-acquisition sense. Email and SMS don't have a cost per new customer, because they market to people who already gave you their contact information, which means you already paid to acquire them through another channel. Their cost is the platform subscription plus the list-building effort. That's why they post the highest returns of any channel: per Klaviyo's benchmark data across more than 183,000 brands, email flows generate roughly 18 times the revenue per recipient of campaigns and drive about 41% of email revenue from just 5.3% of sends. Treat owned channels as a retention and repeat-purchase engine that raises lifetime value, not as a source of net-new customers.
Is your reported ROAS actually making you money?
I've run the media budgets across a multi-brand portfolio, which means I've seen how far a reported ROAS can drift from the bank account. If you want to know where your true CAC sits, which channel is quietly unprofitable at scale, and what you can actually afford to pay, start with the max allowable CAC calculator, then let's talk. The form takes two minutes.
Start a conversation Run the Max Allowable CAC calculator →