The category you operate in sets your acquisition multiple before your own numbers move you inside it. Beauty tops the 2026 table at roughly 3x to 5x revenue and mid-teens EBITDA. Food and beverage runs the widest, from under 1x to nearly 6x revenue. Apparel and most home durables anchor the floor near 0.5x to 1.8x revenue.
- Gross margin is the single biggest reason one category outranks another, because it is what funds the growth a buyer pays for.
- Revenue multiples attach to fast-growing, high-margin brands; EBITDA multiples to steady, profitable ones. Which conversation you are in is set by the category and your own numbers.
- Named 2026 deals anchor every band, from Prestige and Breathe Right at the top to Wacoal and Glamorise at the floor.
A brand's category decides more of its price than its own numbers do, and most founders learn that the expensive way. Ask early and the question comes as "what's my brand worth?" Ask a year later, once an actual offer has landed on the table, and it turns into "why is this half of what I expected?" Almost every time, the gap between the number you hoped for and the offer is the category talking. A $20M business growing 25% at a healthy margin prices completely differently selling lipstick than it does selling protein bars or leggings, and most founders are holding themselves to the wrong category's headline multiple.
What follows puts the whole consumer market on one page instead of one category at a time: a revenue multiple and an EBITDA multiple for each of the six segments that make up most of the deal flow (beauty, wellness and self-care, supplements, food and beverage, apparel and footwear, and home). Every band is anchored to named 2026 deals with a disclosed or credibly reported multiple, so the math is visible instead of assumed.
My read on these numbers comes from having worked both sides of the transaction. Building consumer brands and buying others to fold into portfolios that eventually reached nine figures meant running the quality-of-earnings process that takes a founder's reported numbers apart line by line, then watching what an acquirer actually pays for once the pitch deck closes. None of it is magic: a multiple is a proxy for margin, growth, durability, and category position, and category position carries more of that weight than most founders are willing to admit.
Two things worth flagging before the table. Every figure traces to a real disclosed deal or a published sector benchmark, sourced to firms including Capstone Partners, Baker Tilly, and Investec. Enterprise value and revenue timing are rarely disclosed exactly, so the implied multiples are approximations: read them as the shape of the market rather than a quote on your own brand. This is also the cross-category view specifically. For a brand-by-brand cut of the richest category, the beauty brand multiple breakdown goes deeper inside the top of this table, the realistic DTC exit at $3.25M shows what one ordinary outcome actually looks like up close, and the consumer brand exits tracker, updated weekly, is the live feed this table gets distilled from.
The whole consumer
map, ranked top to
floor.
Beauty sits at the top, averaging about 3.6x EV to revenue from 2022 to YTD 2025 and roughly 14.9x EV to EBITDA in YTD 2025, per Capstone Partners, well above the roughly 9.8x EBITDA average for the broad consumer industry. Apparel anchors the floor, where the average M&A EBITDA multiple slid to about 8.2x across 2023 to 2025, per Capstone via SGB Media. Food and beverage runs the widest spread of any category. The table below is the map, and the rest of the post is the legend.
| Category | Typical revenue multiple | Typical EBITDA multiple | What sets the band |
|---|---|---|---|
Beauty & personal care Skincare, color, haircare, fragrance | 3–5x (breakout 5–8x+) | ~14–15x strategic; 3–5x financial | ~69% gross margin, scarcity |
Wellness & self-care OTC, functional personal care | ~1.3–5x | ~11–12x | Repeat behavior, brand durability |
Supplements & VMS Vitamins, protein, functional | ~2–4x | ~10–11x | Hero product, platform roll-up |
Food & beverage Spirits and premium at the high end | ~1–3x (spirits higher) | ~10–14x (lower-mid-market 4–6x) | Velocity, margin, trade spend |
Apparel & footwear Premium and athleisure higher | ~0.5–1.8x (premium 2–3x) | ~8–11x | Brand IP, DTC mix, promo dependence |
Home & housewares Consumable CPG at the high end | ~0.9–1.8x | ~3–12x | Consumable vs durable, repeat |
Read the table as a ranking, not a promise. The ordering is stable across cycles: beauty and personal care command the richest multiples, supplements and wellness sit a notch below, food and beverage is a wide middle that depends heavily on sub-category, and apparel and most home durables live at the floor. Where a single band is wide, like food and beverage or home, that width is the story: a spirits brand and a private-label snack are both "food and beverage" and price four turns apart. The category sets your starting band, and the levers covered further down move you inside it.
One number frames all of it. The broad consumer industry has traded around 9.8x EV to EBITDA, per Capstone. Beauty sits five turns above that, apparel a turn or two below, and everything else clusters near it. If you want a single mental anchor, start at roughly 10x EBITDA for an average, profitable consumer brand, then adjust up for beauty and margin, down for apparel and fashion risk. That is the crude version of the entire table, and it is right more often than any founder's gut.
One practical warning applies to revenue multiples. A revenue multiple only makes sense as shorthand when you know the margin underneath it, because a 3x revenue multiple on a 70% gross-margin beauty brand and a 3x on a 30% gross-margin snack are describing completely different businesses. That is why the table carries both columns. When a banker or a peer quotes you a revenue multiple with no margin attached, they are quoting you a number that cannot be compared across categories, which is the mistake this table exists to fix.
The 2026 deals that
actually set these
numbers.
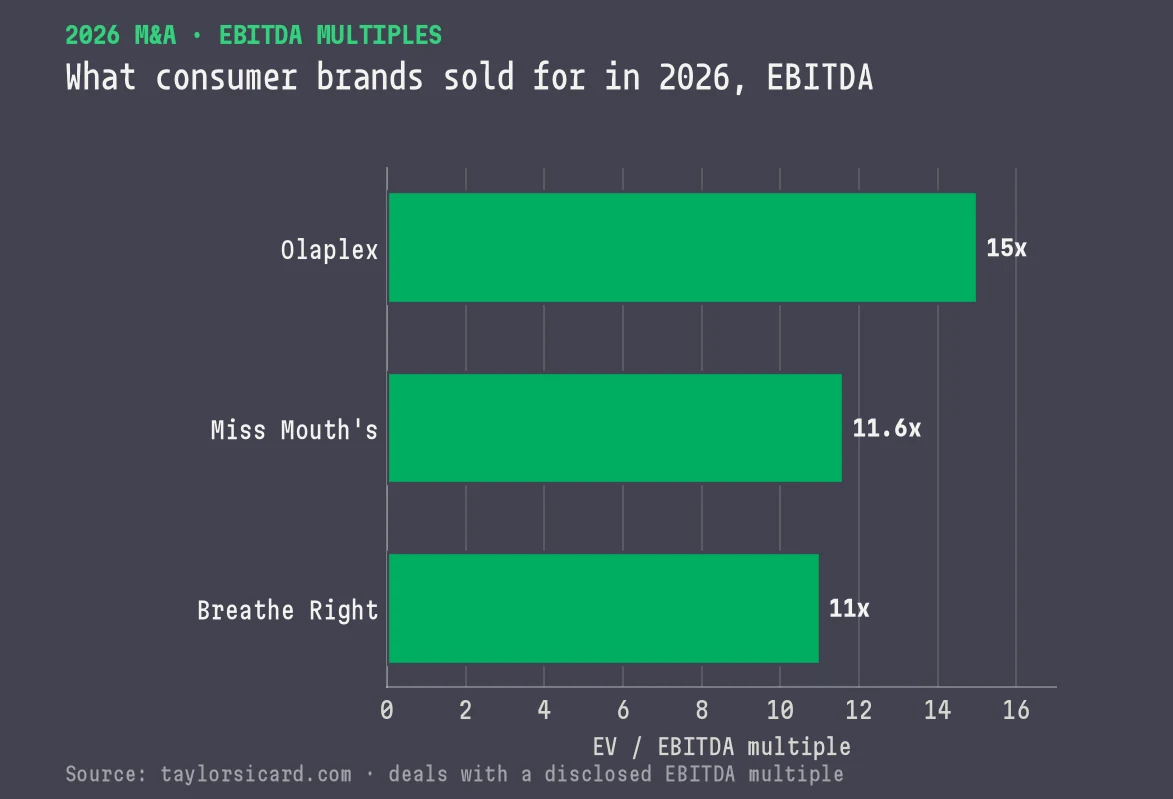
A range is only as good as the deals under it, so here is the ledger. Each row is a 2026 consumer transaction with a disclosed or credibly reported multiple, pulled from company releases, wire reports, and trade coverage inside the broader consumer M&A window that reopened in 2026. The pattern in the table is the whole argument: the same disclosed EBITDA multiple, roughly 11x to 12x, shows up on Breathe Right, Miss Mouth's, and Edgewell's feminine-care unit, three very different brands, because buyers converge on cash-flow math once a brand is proven and profitable.
| Deal (2026) | Category | Price | Disclosed / reported multiple |
|---|---|---|---|
Breathe Right → Prestige OTC nasal strips | Wellness | $1.045B | 5.2x sales · ~11x EBITDA |
Olaplex → Henkel Premium haircare, take-private | Beauty | ~$1.4B | ~15x adj EBITDA (reported) |
FineToday → Bain Capital Personal-care platform | Beauty | $1.29B | 1.87x FY24 sales |
Miss Mouth's → Church & Dwight Stain remover, from Thrasio estate | Home | ~$325M | 4.1x sales · 11.6x EBITDA |
Edgewell fem-care → Essity Feminine care unit | Wellness | $340M | 1.30x sales · 12.1x EBITDA |
Gruns → Unilever Gummy multivitamin | Supplements | ~$1.2B (reported) | ~4x sales on ~$300M run rate |
Huel → Danone Meal replacement | Food-bev | $1.15B | ~3.4x FY25 sales |
Four Roses → E.&J. Gallo Kentucky bourbon | Food-bev | $715M + $50M earnout | 5.96x sales |
Nathan's Famous → Smithfield Branded hot dogs | Food-bev | $450M | 2.9x sales · 12.4x EBITDA |
Bachan's → Marzetti Japanese barbecue sauce | Food-bev | $400M | ~4.6x projected sales |
Tupperware LatAm → Betterware Housewares, direct sales | Home | $250M | 0.90x sales · 3.1x EBITDA |
Everlane → Shein DTC apparel | Apparel | ~$100M (reported) | ~0.6x sales |
Glamorise → Wacoal Intimates | Apparel | $33M (reported) | 0.8x sales |
A note on confidence, because it matters for how much weight to put on each row. The Breathe Right, Miss Mouth's, Olaplex, Huel, and Gruns deals are verified from company releases or major wires; the multiples on Breathe Right (Prestige Consumer Healthcare) and Miss Mouth's (Church & Dwight) were disclosed by the acquirers themselves. The Everlane, Glamorise, and Gruns dollar figures are reported by trade and secondary sources rather than officially confirmed, so treat those as directional. I have kept the unverifiable numbers out entirely rather than round up to a cleaner story, which is the same discipline a buyer's quality-of-earnings team will apply to your P&L.
Look at the vertical spread and the category ranking jumps off the page. The three richest EBITDA multiples in the ledger, Olaplex at a reported 15x, Nathan's at 12.4x, and Edgewell fem-care at 12.1x, belong to beauty, a heritage branded food business, and a profitable OTC-adjacent line. The two lowest revenue multiples, Everlane at roughly 0.6x and Glamorise at 0.8x, are both apparel. That is the category effect showing up in real 2026 prices, not a run of unusual deals, and it is why a founder's first job is to know which row of Figure 1 they actually live in.
"The same 11x to 12x EBITDA multiple shows up on nasal strips, stain remover, and feminine care. Buyers converge on cash-flow math the moment a brand is proven."
Revenue multiple or
EBITDA multiple: which
one you get.
Every consumer brand gets valued one of two ways, and which one applies tells you exactly how the buyer sees you. A fast-growing, high-margin brand gets a revenue conversation, because the buyer is paying ahead of the cash flow for growth they believe will keep compounding. A steady, profitable brand gets an EBITDA conversation, because the buyer is underwriting the cash the business already produces. The category tilts which conversation is even available to you, and your own numbers decide where inside it you land.
In food, beverage, and supplements, buyers almost always anchor on EV to EBITDA, because it is the cleanest read on cash earnings power in categories where margins are thinner and more volatile. Investec and Baker Tilly both describe food and beverage deals pricing primarily off EBITDA, with EV to revenue reserved for high-growth brands whose profit is temporarily depressed by growth spend. Beauty is the exception that leans the other way: its margins are high enough that a revenue multiple carries real meaning, which is why the headline beauty deals get quoted in revenue turns.
This is where founders lose the most money. A brand doing $20M at a 10% EBITDA margin dreams in revenue turns, imagines 4x, and pictures an $80M outcome. But if growth has cooled and a financial buyer is the realistic acquirer, the actual conversation is 5x to 8x EBITDA on $2M of profit, which is $10M to $16M. Those two numbers describe the same company, and the gap between them is entirely about which multiple gets applied. The revenue multiple only attaches to a specific, scarce kind of brand, and assuming you qualify when you don't is how a process falls apart in diligence.
| Brand profile | Likely basis | Why |
|---|---|---|
Fast growth, high margin, scarce Beauty breakout, hot functional brand | Revenue | Buyer pays ahead of the cash flow |
Steady, profitable, category-typical Most food, wellness, home CPG | EBITDA | Buyer underwrites current cash |
Strong brand IP, weak operating margin Heritage apparel, licensable names | Revenue or asset / license | Buyer prices the mark, not the P&L |
Thin margin, discount-led, capital-hungry Promo-dependent DTC in any category | Distressed / earnout | Repriced down or paid on the come |
The apparel row is worth pausing on, because it explains a lot of the floor in Figure 1. When a fashion brand has a strong name but a broken operating margin, buyers stop pricing the business and start pricing the trademark. That is why brand-management firms like Authentic Brands and WHP Global are so active at the apparel floor: they buy the intellectual property, license out the operations, and never touch the money-losing P&L. It is a different kind of deal with a different kind of math, and it is why "apparel multiples" are so wide and so often quoted as revenue rather than EBITDA.
The practical move is the same in every category: know honestly which conversation your brand is built for, then build toward the version that pays more. If you have real growth and defensible margin, protect the growth and tell the revenue story. If you are a steady cash generator, get your EBITDA clean and defensible and tell that story. The worst outcome is telling a revenue story to a buyer running EBITDA math, because the mismatch surfaces the moment diligence opens and the price resets down. Choosing the story is quick; getting the numbers to support it is what pre-process preparation is actually for. If you want to pressure-test your own profit before a buyer does, the DTC profitability calculator models the EBITDA line an acquirer will actually underwrite.
Why margin decides
which category wins
the multiple.
The category ranking in Figure 1 tracks gross margin almost one to one, far more closely than it tracks brand love. Public beauty runs about a 69% median gross margin, the highest of any ecommerce vertical, versus roughly 56% for broad DTC, per the sector benchmarks. Apparel and food carry meaningfully lower margins. High gross margin is what funds the marketing that drives the growth a buyer is paying for, so acquirers pay more per dollar of revenue in high-margin categories.
Think about why this compounds into a category-level effect. A 69% gross-margin brand can spend aggressively to acquire customers and still keep contribution margin positive, which means it can grow faster for longer before the economics break. It can absorb a tariff shock, a freight spike, or a promotional stretch without falling into the red. It can fund retention, sampling, and the kind of demand-building that makes a brand durable. A 30% gross-margin snack cannot do those things at the same intensity, so it grows slower, defends worse, and gets priced lower.
Durability is the second axis, and it reinforces the same ranking. Beauty, wellness, and supplements tend to have stronger repeat behavior than apparel, where fashion risk and seasonality make next year's revenue less certain. A buyer pays for revenue they can count on and discounts revenue they can't. This is why a profitable OTC or supplement brand can clear 11x EBITDA while a profitable fashion brand at the same margin struggles to clear 9x: the OTC customer comes back on a schedule, and the fashion customer might not come back at all. The same category-specific unit economics that shape a brand's day-to-day also shape its exit.
There is a channel dimension buried in the ranking too. Within any category, a brand with diversified, durable margins gets the high end of its band, and one whose margin depends on a single retailer, a single marketplace, or a discount habit gets the low end. I have watched a brand with a beautiful reported margin get repriced hard in diligence because 70% of its revenue ran through one channel that could change terms at any time. Concentration is behind most of the diligence red flags that make a buyer walk, and it caps your multiple inside your category no matter how strong the top line looks.
Beauty, and why it
sits at the top of
the table.
Beauty commands the richest multiples in consumer, and no other category is close. The sector averaged about 3.6x EV to revenue from 2022 to YTD 2025 and roughly 14.9x EV to EBITDA in YTD 2025, per Capstone Partners, more than five turns above the broad consumer EBITDA average. Core prestige and premium brands trade around 3x to 5x revenue, while breakout, celebrity-led, or strategically scarce brands push 5x to 8x and occasionally beyond. The engine, as covered above, is that ~69% gross margin.
The 2026 deals bear this out at both ends. Henkel took Olaplex private near $1.4B at a reported 15x adjusted EBITDA, a rich multiple for a premium haircare brand it wanted for its professional portfolio. At the other end, Bain Capital paid $1.29B for the FineToday personal-care platform at about 1.87x FY24 sales, a lower revenue turn that reflects a mature, scaled, financial-buyer deal rather than a hot growth story. Both are "beauty," and the four-turn spread between their revenue multiples is the same growth-and-scarcity story that runs through every category, just at a higher baseline.
Strategics set the top of the beauty band because they can underwrite synergies a spreadsheet can't. L'Oreal's run of deals, the Kering Beaute and Creed acquisition, the Color Wow professional-haircare buy, and majority stakes in fast-growing skincare houses, each filled a specific portfolio gap the company couldn't build organically fast enough. When a strategic sees your brand as the missing piece, they pay above what any financial model alone would justify. When nobody does, you fall back to the financial-buyer math, and the premium evaporates. That dynamic is covered brand by brand in the beauty-only multiple breakdown.
For a founder in an adjacent category, beauty is worth understanding even if you don't sell it, because the beauty premium leaks outward. Brands that sit credibly at the intersection of beauty, wellness, and self-care can attract beauty strategics, household-products majors, and consumer-health buyers all at once, and more bidders is what actually moves a multiple. The closer your margin and repeat profile look to beauty's, the closer your multiple can climb toward beauty's band.
Wellness and self-care,
the quiet 11x to 12x
category.
Wellness and self-care sit a rung below beauty and pay better than most founders expect, clustering around 11x to 12x EV to EBITDA for proven, profitable brands. The 2026 anchors are unusually clean here. Prestige Consumer Healthcare paid $1.045B for Breathe Right at about 5.2x sales and roughly 11x EBITDA, on a brand doing around $200M in revenue at a 47% EBITDA margin. Essity paid $340M for Edgewell's feminine-care unit at 1.30x sales and 12.1x EBITDA. Both are boring, durable, high-repeat businesses, and both cleared the consumer-average EBITDA multiple comfortably.
The reason the wellness band is so sturdy is repeat behavior. An OTC remedy, a deodorant, or a feminine-care product gets bought on a replacement cycle, not an impulse, which makes next year's revenue easier for a buyer to underwrite. That predictability is worth turns of EBITDA. Household and consumer-health majors chase these brands right alongside beauty strategics for the same reason: Church & Dwight, Prestige, and Essity all built their portfolios by buying durable, repeat-driven self-care assets and running them through an efficient P&L.
There is a widening-buyer-pool effect in wellness that directly supports the multiple. When Church & Dwight, a company best known for Arm & Hammer, paid up for a beauty-adjacent hand-care brand, or when a household-products major buys a self-care line, it signals that the wellness halo is pulling in bidders and dollars from well beyond the traditional category acquirers. More buyer types means more competitive tension, and competitive tension moves a number far more than the pitch deck does. A brand that credibly spans wellness and beauty has structurally more potential homes than one that sits squarely in either. The full list of supplement and wellness brand acquisition multiples runs from Unilever to Prestige to private equity, and it is wider than the category's own history suggests.
The caution is that the wellness premium attaches to authentic repeat behavior, not to a wellness label on an ordinary product. Sophisticated buyers can tell a brand that really owns a ritual from one that borrowed the language for a raise, and they look for the durability in the cohort data. A wellness story the retention curves contradict is worth less than no story at all, because now the buyer questions the rest of the narrative. Prove the repeat, and the wellness band is one of the most reliable places to exit in consumer.
Supplements, where a
hero product buys a
premium turn.
Supplements, vitamins, and functional nutrition (the VMS category) have averaged about 10.7x EV to EBITDA between 2024 and YTD 2025, per Capstone Partners, a touch above the roughly 9.7x consumer-industry average over the same window. Capstone notes the premium clusters on brands with one or more widely adopted products: a genuine hero SKU with mass distribution props up the whole valuation. The typical VMS target generates $10M to $100M of EBITDA at an enterprise value of $100M to $1B, which tells you this is a real platform category, not a niche.
The 2026 headline is Unilever's move on Gruns, a gummy multivitamin brand under three years old at roughly a $300M revenue run rate. Unilever did not disclose the price, but Forbes and Inc reported it near $1.2B, which would imply about 4x sales for a fast-growing hero-product brand. That revenue multiple only makes sense because the growth and the single breakout SKU justify paying ahead of the profit. It is the supplements version of the beauty breakout: a scarce, fast-scaling brand pulling a revenue conversation in a category that usually trades on EBITDA.
Private equity is unusually active at the VMS mid-market, and it changes the math for founders. Capstone reports financial-sponsor supplement M&A rebounding sharply, with sponsors building scalable platforms and buying add-ons to justify them. That platform appetite means a well-run sub-scale supplement brand has more potential homes than it did a couple of years ago, and more homes means more competition for the good ones. The flip side is that sponsors underwrite to cash flow, so they pay for a supplement brand's defensible EBITDA and discount the marketed version. That is the EBITDA line that makes a brand sellable, and it decides your outcome more than your top line.
The structural risk in supplements is concentration and claims. A brand carried by one hero SKU gets the premium turn on the way up and the discount on the way down, because a buyer prices the risk that the hero fades or draws a regulatory challenge. The brands that hold the top of the VMS band pair a hero product with a real second and third act, clean substantiation for their claims, and retention that proves the customer stays past the first bottle. A single-SKU story with a thin assortment underneath is a valuation waiting to be repriced in diligence.
Food and beverage, the
category that prices
four turns apart.
Food and beverage is the widest category in consumer, and treating it as one number is the fastest way to misprice a brand. The sector benchmark sat around 3.1x EV to sales and 14.7x EV to EBITDA at a recent reading (Investec, Q1 2026), but lower-middle-market deals routinely close at just 4x to 6x EBITDA, per Baker Tilly. The gap between those two figures is the difference between a scaled beverage platform and a small private-label food maker, both correctly labeled "food and beverage."
The 2026 ledger shows the full spread inside one category. E.&J. Gallo paid $715M plus a $50M earnout for Four Roses bourbon at 5.96x sales, because premium spirits carry brand equity, aging inventory, and pricing power that justify a rich revenue turn. Danone paid $1.15B for Huel at about 3.4x sales for a fast-growing meal-replacement brand. Smithfield paid $450M for Nathan's Famous at 2.9x sales and 12.4x EBITDA for a heritage branded business. And at the bottom, undifferentiated snack and private-label food assets changed hands at well under 1x revenue and low-single-digit EBITDA multiples.
The rule inside food and beverage is that sub-category and pricing power set your band. Spirits and premium beverages sit at the high end because of brand equity and margin. Branded, high-velocity packaged food with disciplined trade spend sits in the profitable middle. Commodity, private-label, or promotion-dependent food anchors the bottom, because the buyer is really buying a manufacturing footprint, not a brand. If you operate here, ask honestly if you own pricing power and repeat velocity or are a co-packer with a logo, because the two get valued in different postal codes.
Buyers in this category anchor on EBITDA harder than almost anywhere else, which changes how you should prepare. Investec and Baker Tilly both stress that food and beverage buyers reward clean quality-of-earnings support, defensible normalized EBITDA, disciplined trade-spend governance, and a working-capital profile they can understand. Trade spend does the most damage here: a top line inflated by promotional allowances that a buyer normalizes out can erase a turn of value overnight. In food and beverage, the brand that wins the high end of the band is the one whose margin survives the buyer rebuilding it from scratch.
There is a scale premium worth naming. The richest food and beverage multiples go to brands big enough and clean enough to matter to a strategic, because a $200M brand with real velocity can move a major's category share while a $15M brand cannot. That is why the same growth rate earns a higher multiple at scale: growth gets a brand considered, and relevance is what the buyer pays for. A sub-scale food brand is often better served by a platform or a financial sponsor building toward that scale, the same way holding companies approach consumer roll-ups, than by holding out for a strategic premium it is too small to command.
Apparel and home, the
floor and the licensing
escape hatch.
Apparel and most home durables anchor the floor of the consumer table, and the numbers are sobering. Most apparel and footwear brands sell for roughly 1.0x to 1.8x revenue or 8x to 11x EBITDA in 2026, and the sector's average M&A EBITDA multiple fell to about 8.2x across 2023 to 2025, down from 12.0x in 2020 to 2022, per Capstone via SGB Media. Mass and distressed apparel clears under 1x revenue, while high-growth, high-DTC performance and athleisure brands push 2x to 3x. The 2026 ledger fits: Wacoal bought Glamorise at 0.8x sales, and Shein reportedly bought Everlane at about 0.6x.
The reason apparel sits at the floor is the mirror image of why beauty sits at the top. Lower gross margins, heavier promotion, seasonal fashion risk, and weaker repeat all make next year's revenue less certain, and a buyer discounts uncertainty. An apparel brand at the same reported margin as a wellness brand still trades lower, because the buyer is less sure the revenue recurs. The category effect works the same way it does at the top, in reverse: structure sets the band more than brand quality does.
Apparel has an escape hatch the other categories mostly lack, and it explains the wide, revenue-based quotes. When a fashion brand has a strong name but a broken P&L, brand-management firms buy the intellectual property and license out operations, pricing the trademark rather than the business. Authentic Brands, WHP Global, and Marquee Brands ran this play repeatedly in 2026 across heritage names, taking IP majority stakes and leaving the money-losing operations to licensees. If your apparel brand's value is really in the mark, a licensing deal can beat an operating sale, but it is a very different transaction with its own economics.
Home is a split category, which is why its EBITDA band in Figure 1 runs so wide. Consumable home CPG behaves like wellness: Church & Dwight paid about $325M for Miss Mouth's stain remover at 4.1x sales and 11.6x EBITDA, a rich multiple for a high-repeat consumable with a number-one Amazon position, bought out of the bankrupt Thrasio estate. Home durables behave like apparel: Betterware bought Tupperware's Latin American housewares business at 0.90x sales and just 3.1x EBITDA. The same rule runs through the whole table: repeat consumables get the high end, one-time durables get the floor, and the word "home" tells you almost nothing on its own.
For a founder at the floor of the table, the strategy is to be the best possible version of your own category. A premium, high-DTC, strong-repeat apparel brand can clear 2x to 3x revenue while its promo-dependent neighbor clears 0.7x, and a consumable home brand with real repeat can trade like wellness. The category sets your band, but the top of a floor category still beats the bottom of a premium one, and getting to the top of your own band is entirely within your control.
The levers that move
you up inside your
category.
The category sets your band, but there is real range inside every band, and the levers that move you up are the same in all six categories. A revenue or EBITDA multiple is a proxy for a handful of things a buyer can underwrite: durable gross margin, real and profitable growth, diversified and defensible operating margin, a category position worth owning, and a business that runs without its founder. Deliver strongly on all of them and you sit at the top of your category's band. Miss two and you sit at the bottom, no matter how good the product is.
Why first: Gross margin is what decides your category's ceiling and your position inside it, and it is the highest-leverage move at most revenue bands. Everything else is built on the margin engine.
Why it matters: Durability is the second axis after margin, and it is what separates the top of a band from the bottom. It converts a momentum story into an annuity a buyer underwrites at the high end.
The payoff: When the buyer's diligence matches the number you marketed, you keep your leverage and your price. A defensible number negotiated from strength beats a soft one defended from the back foot.
Concentration and founder dependency are the two levers that cap the most multiples, and they show up in every category. Buyers see the risk and discount for it, whether one channel carries the majority of revenue or the founder is still doing the product work, running the marketing, and closing every deal personally. A team and systems that let the brand run without you protects the value you've built more directly than almost anything else on this list, the same first operator hire that reduces founder dependency, and it matters most at the smaller revenue bands, where the dependency is most acute.
One caveat: not every brand should be engineered for a sale, and a multiple built only to flip a business tends to be brittle. This runway works because it builds a better business whether or not you ever sell. Higher durable margin, stronger retention, diversified channels, and a brand that runs without its founder are good for the company regardless of an exit. Sale-readiness comes as a byproduct of building well, and the work that lifts your multiple is the same work that makes the business worth keeping.
A consumer multiple tracks margin, growth, durability, and category position, in roughly that order of leverage. Beauty sits at the top of the table on a 69% gross margin and strong repeat. Apparel sits at the floor on thin margins and fashion risk. Food and beverage runs widest of all because a bourbon brand and a private-label snack both wear that same label. Figure out which row you actually live in, then build deliberately toward the top of your own band. That work covers most of what a founder can control here.
If you're building a consumer brand toward a sale and you want to know which band your category sits in and what would move you up inside it, that is the buy-side work I've run, applied to your brand before a buyer applies it to you. The DTC growth consulting practice exists for this pre-deal work, the profitability teardown shows how the real numbers tend to diverge from the deck, the map of who's actually buying consumer brands shows which acquirers set the top of each category's band, and the running consumer exits tracker keeps the named deals current as the year plays out.
Questions founders ask
about multiples by
category.
What multiple do consumer brands sell for by category in 2026?
It depends heavily on the category. Beauty tops the table at roughly 3x to 5x revenue (breakout brands 5x to 8x) and mid-teens EV to EBITDA. Wellness, self-care, and supplements sit at about 1.3x to 5x revenue and 10x to 12x EBITDA. Food and beverage runs the widest, from under 1x to nearly 6x revenue and 4x to 14x EBITDA. Apparel and most home durables anchor the floor at roughly 0.5x to 1.8x revenue and 8x to 11x EBITDA.
Which consumer category commands the highest acquisition multiple?
Beauty and personal care. The sector averaged about 3.6x EV to revenue from 2022 to YTD 2025 and roughly 14.9x EV to EBITDA in YTD 2025, per Capstone Partners, well above the roughly 9.8x consumer-industry EBITDA average. The reason is gross margin: public beauty runs near a 69% median, the highest of any ecommerce vertical, which funds the growth an acquirer is paying for.
Do consumer brands sell on a revenue or an EBITDA multiple?
Both, and which one applies tells you how the buyer sees the brand. Fast-growing, high-margin brands get a revenue conversation because the buyer is paying ahead of the cash flow. Steady, profitable brands get an EBITDA conversation because the buyer is underwriting cash the business already throws off. In food, beverage, and supplements, buyers almost always anchor on EV to EBITDA; in high-growth beauty, revenue multiples do more of the work.
Why do beauty brands sell for more than apparel brands?
Gross margin and durability. Public beauty runs about a 69% median gross margin versus roughly 56% for broad DTC, and its repeat behavior is stronger, so acquirers pay more per dollar of revenue. Apparel carries lower margins, heavier promotion, and more fashion risk, so its average M&A EBITDA multiple fell to about 8.2x across 2023 to 2025 (Capstone), and mass or distressed apparel clears under 1x revenue.
What example deals set the 2026 multiples by category?
Prestige paid $1.045B for Breathe Right at about 5.2x sales and roughly 11x EBITDA. Church & Dwight paid about $325M for Miss Mouth's at 4.1x sales and 11.6x EBITDA. Henkel took Olaplex private near $1.4B at a reported 15x EBITDA. Danone paid $1.15B for Huel at about 3.4x sales. Wacoal bought Glamorise at 0.8x sales. Each anchors its category's band.
Which band does your category actually sit in?
I've run buy-side diligence and quality-of-earnings work on consumer brands across categories, and I've built brands sold into a nine-figure portfolio. If you're a year or two from a potential exit, I can tell you which band your category sits in, where you land inside it, and what's quietly capping your number, before a buyer does. The form takes two minutes.
Start a conversation Model your profit first →